Exam 3: Where Prices Come From: the Interaction of Demand and Supply
Exam 1: Economics: Foundations and Models160 Questions
Exam 2: Choices and Trade Offs in the Market192 Questions
Exam 3: Where Prices Come From: the Interaction of Demand and Supply201 Questions
Exam 4: Gdp: Measuring Total Production, Income and Economic Growth123 Questions
Exam 5: Economic Growth, the Financial System and Business Cycles132 Questions
Exam 6: Long-Run Economic Growth: Sources and Policies118 Questions
Exam 7: Unemployment120 Questions
Exam 8: Inflation110 Questions
Exam 9: Aggregate Expenditure and Output in the Short Run138 Questions
Exam 10: Aggregate Demand and Aggregate Supply Analysis134 Questions
Exam 11: Money, Banks and the Reserve Bank of Australia123 Questions
Exam 12: Monetary Policy116 Questions
Exam 13: Fiscal Policy163 Questions
Exam 14: Macroeconomics in an Open Economy141 Questions
Exam 15: The International Financial System145 Questions
Select questions type
Figure 3.8
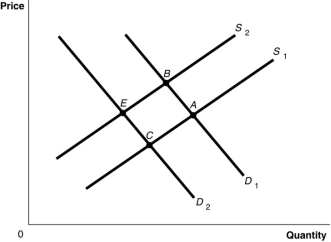 -Refer to Figure 3.8. The graph in this figure illustrates an initial competitive equilibrium in the market for apples at the intersection of D₂ and S₂ (point E). Which of the following changes would cause the equilibrium to change to point A?
(Multiple Choice)
5.0/5  (46)
(46)
What is the ceteris paribus condition?
_____________________________________________________________________________________________
_____________________________________________________________________________________________
(Essay)
5.0/5 (30)
Figure 3.2
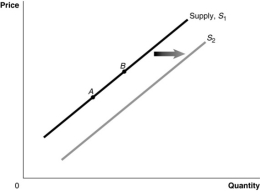 -Refer to Figure 3.2. An increase in the price of substitutes in production would be represented by a movement from:
(Multiple Choice)
4.7/5 (39)
Table 3.1
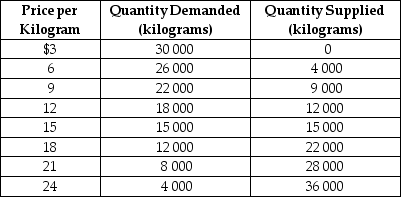 -Refer to Table 3.1. The table contains information about the corn market. Use the table to answer the following questions.
a.What are the equilibrium price and quantity of corn?
b.Suppose the prevailing price is $9 per kilogram. Is there a shortage or a surplus in the market?
c.What is the quantity of the shortage or surplus?
d.How many kilograms will be sold if the market price is $9 per kilogram?
e.If the market price is $9 per kilogram, what must happen to restore equilibrium in the market?
f.At what price will suppliers be able to sell 22 000 kilograms of corn?
g.Suppose the market price is $21 per kilogram. Is there a shortage or a surplus in the market?
h.What is the quantity of the shortage or surplus?
i.How many kilograms will be sold if the market price is $21 per kilogram?
j.If the market price is $21 per kilogram, what must happen to restore equilibrium in the market?
_____________________________________________________________________________________________
_____________________________________________________________________________________________
-Refer to Table 3.1. The table contains information about the corn market. Use the table to answer the following questions.
a.What are the equilibrium price and quantity of corn?
b.Suppose the prevailing price is $9 per kilogram. Is there a shortage or a surplus in the market?
c.What is the quantity of the shortage or surplus?
d.How many kilograms will be sold if the market price is $9 per kilogram?
e.If the market price is $9 per kilogram, what must happen to restore equilibrium in the market?
f.At what price will suppliers be able to sell 22 000 kilograms of corn?
g.Suppose the market price is $21 per kilogram. Is there a shortage or a surplus in the market?
h.What is the quantity of the shortage or surplus?
i.How many kilograms will be sold if the market price is $21 per kilogram?
j.If the market price is $21 per kilogram, what must happen to restore equilibrium in the market?
_____________________________________________________________________________________________
_____________________________________________________________________________________________
(Essay)
4.9/5 (32)
Which of the following would shift the supply curve for tablet computers to the left?
(Multiple Choice)
4.8/5 (36)
Explain the differences between a 'change in supply' and a 'change in quantity supplied'.
_____________________________________________________________________________________________
_____________________________________________________________________________________________
(Essay)
4.9/5 (32)
An increase in the price of inputs will cause the supply curve for a product to shift to the right.
(True/False)
4.9/5 (36)
Let D = demand, S = supply, P = equilibrium price, Q = equilibrium quantity. If the government taxes the activity of logging tropical forests, what happens in the market for tropical hardwood?
(Multiple Choice)
4.9/5 (28)
In February, market analysts predict that the price of titanium will rise in March. What happens in the titanium market in February, holding everything else constant?
(Multiple Choice)
4.9/5 (47)
A 'shortage' is defined as the situation that exists when the quantity of a good supplied is greater than the quantity demanded.
(True/False)
4.9/5 (34)
If consumers believe the price of LCD televisions will decrease in the future, this will cause the demand for LCD televisions to increase now.
(True/False)
4.9/5 (29)
The equilibrium price will increase if the demand curve for a product shifts to the right and the supply curve for the product shifts to the left.
(True/False)
4.8/5 (38)
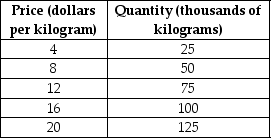
Use the following supply schedule for cherries to draw a graph of the supply curve. Be sure to label the supply curve and each axis, and show each point on the supply curve.
(Essay)
4.9/5 (39)
If consumers expect that Apple will introduce a new model iPad soon, this will cause the demand for the current iPads will decrease now.
(True/False)
4.9/5 (33)
An increase in the price of off-road vehicles will result in:
(Multiple Choice)
4.8/5 (30)
As the number of firms in a market increases, the supply curve will shift to the right and the equilibrium quantity will rise.
(True/False)
4.8/5 (37)
Filters
- Essay(0)
- Multiple Choice(0)
- Short Answer(0)
- True False(0)
- Matching(0)