Exam 15: Monopoly and Antitrust Policy
Exam 1: Economics: Foundations and Models240 Questions
Exam 2: Trade-Offs, Comparative Advantage, and the Market System258 Questions
Exam 3: Where Prices Come From: the Interaction of Demand and Supply242 Questions
Exam 4: Economic Efficiency, Government Price Setting, and Taxes208 Questions
Exam 5: Externalities, Environmental Policy, and Public Goods262 Questions
Exam 6: Elasticity: the Responsiveness of Demand and Supply293 Questions
Exam 7: The Economics of Health Care171 Questions
Exam 8: Firms, the Stock Market, and Corporate Governance261 Questions
Exam 9: Comparative Advantage and the Gains From International Trade188 Questions
Exam 10: Consumer Choice and Behavioral Economics304 Questions
Exam 11: Technology, Production, and Costs327 Questions
Exam 12: Firms in Perfectly Competitive Markets297 Questions
Exam 13: Monopolistic Competition: the Competitive Model in a272 Questions
Exam 14: Oligopoly: Firms in Less Competitive Markets257 Questions
Exam 15: Monopoly and Antitrust Policy279 Questions
Exam 16: Pricing Strategy258 Questions
Exam 17: The Markets for Labor and Other Factors of Production279 Questions
Exam 18: Public Choice, Taxes, and the Distribution of Income258 Questions
Select questions type
The first important law regulating monopolies in the United States was
(Multiple Choice)
4.8/5  (34)
(34)
Figure 15-12
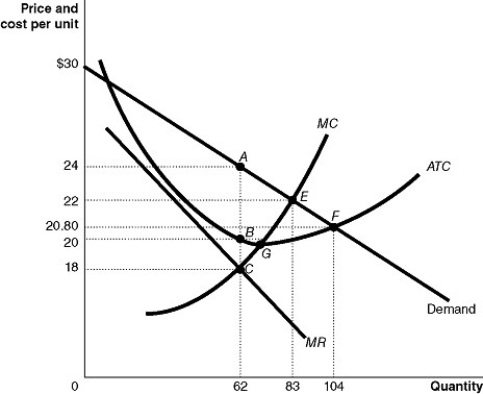 Figure 15-12 shows the cost and demand curves for a monopolist.
-Refer to Figure 15-12.Assume the firm maximizes its profits.What is the amount of the consumer surplus?
Figure 15-12 shows the cost and demand curves for a monopolist.
-Refer to Figure 15-12.Assume the firm maximizes its profits.What is the amount of the consumer surplus?
(Multiple Choice)
4.7/5 (33)
Figure 15-6
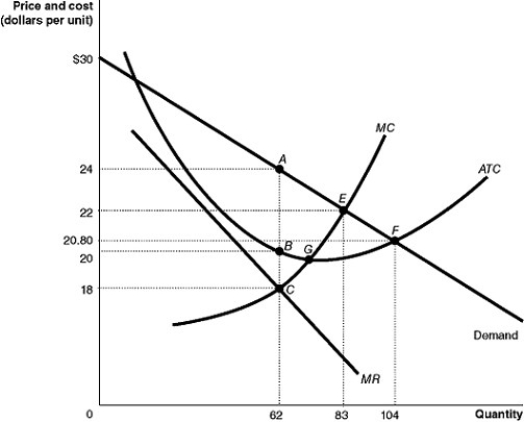 Figure 15-6 shows the cost and demand curves for a monopolist.
-Refer to Figure 15-6.The monopolist earns a profit of
Figure 15-6 shows the cost and demand curves for a monopolist.
-Refer to Figure 15-6.The monopolist earns a profit of
(Multiple Choice)
4.9/5 (36)
Figure 15-8
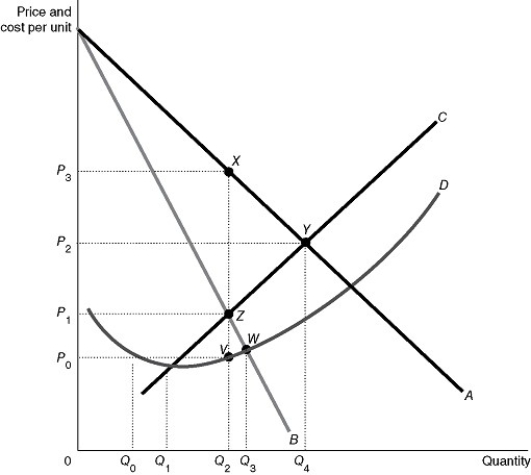 Figure 15-8 reflects the cost and revenue structure for a monopoly that has been in business for a very long time.
-Refer to Figure 15-8.Use the figure above to answer the following questions.
a. Identify the curves labeled A and B.Identify the curve which contains both point Y and point Z.Identify the curve which contains both point V and point W.
b.What is the profit-maximizing quantity and what price will the monopolist charge?
c.What area represents total revenue at the profit-maximizing output level?
d.What area represents total cost at the profit-maximizing output level?
e.What area represents profit?
f.What is the profit per unit (average profit)at the profit-maximizing output level?
g.If this industry was organized as a perfectly competitive industry, what would be the profit-maximizing price and quantity?
h.What area represents the deadweight loss as a result of a monopoly?
Figure 15-8 reflects the cost and revenue structure for a monopoly that has been in business for a very long time.
-Refer to Figure 15-8.Use the figure above to answer the following questions.
a. Identify the curves labeled A and B.Identify the curve which contains both point Y and point Z.Identify the curve which contains both point V and point W.
b.What is the profit-maximizing quantity and what price will the monopolist charge?
c.What area represents total revenue at the profit-maximizing output level?
d.What area represents total cost at the profit-maximizing output level?
e.What area represents profit?
f.What is the profit per unit (average profit)at the profit-maximizing output level?
g.If this industry was organized as a perfectly competitive industry, what would be the profit-maximizing price and quantity?
h.What area represents the deadweight loss as a result of a monopoly?
(Essay)
4.7/5 (34)
If a monopolist's price is $50 at the output where marginal revenue equals marginal cost and average total cost is $43, then the incremental profit from the last unit sold is $7.
(True/False)
4.9/5 (29)
The possibility that the economy may benefit from having market power, rather than being very competitive, is closely identified with which famous economist?
(Multiple Choice)
4.8/5 (43)
According to the Department of Justice merger guidelines, a proposed merger between two firms may be challenged if the post-merger Herfindahl-Hirschman Index
(Multiple Choice)
4.9/5 (34)
There are several types of barriers to entry that can create a monopoly.Which of the following barriers is the result of government action?
(Multiple Choice)
4.8/5 (40)
Figure 15-15
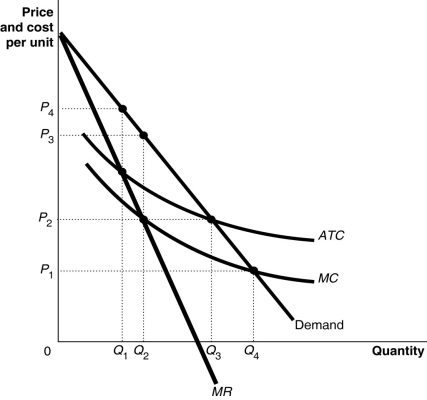 Figure 15-15 shows the cost and demand curves for the Erickson Power Company.
-Refer to Figure 15-15.The firm would maximize profit by producing
Figure 15-15 shows the cost and demand curves for the Erickson Power Company.
-Refer to Figure 15-15.The firm would maximize profit by producing
(Multiple Choice)
4.9/5 (33)
Assume a hypothetical case where an industry begins as perfect competition and then becomes a monopoly.Which of the following statements comparing the conditions in the industry under both market structures is true?
(Multiple Choice)
4.7/5 (35)
Figure 15-9
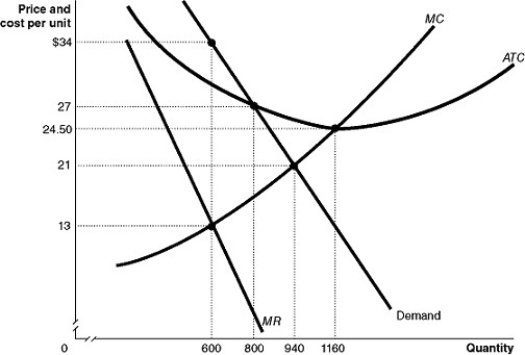 Figure 15-9 shows the demand and cost curves for a monopolist.
-Refer to Figure 15-9.What is the economically efficient output level?
Figure 15-9 shows the demand and cost curves for a monopolist.
-Refer to Figure 15-9.What is the economically efficient output level?
(Multiple Choice)
4.8/5 (27)
Microsoft hires marketing and sales specialists to decide what prices it should set for its products, whereas a wealthy corn farmer in Iowa, who sells his output in the world commodity market, does not.Why is this so?
(Multiple Choice)
4.8/5 (44)
Figure 15-2
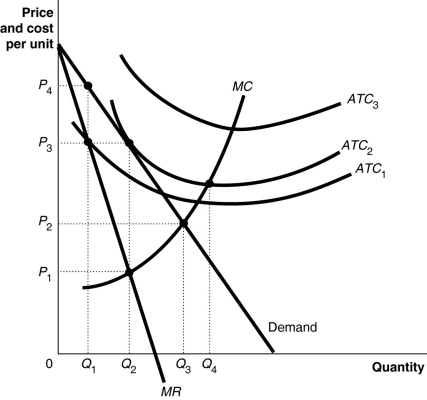 Figure 15-2 above shows the demand and cost curves facing a monopolist.
-Refer to Figure 15-2.If the firm's average total cost curve is ATC₃, the firm will
Figure 15-2 above shows the demand and cost curves facing a monopolist.
-Refer to Figure 15-2.If the firm's average total cost curve is ATC₃, the firm will
(Multiple Choice)
4.9/5 (44)
Merger guidelines developed by the U.S.Department of Justice and the Federal Trade Commission use the Herfindahl-Hirschman Index as a measure of concentration.This index measures concentration in an industry by
(Multiple Choice)
4.9/5 (38)
Figure 15-14
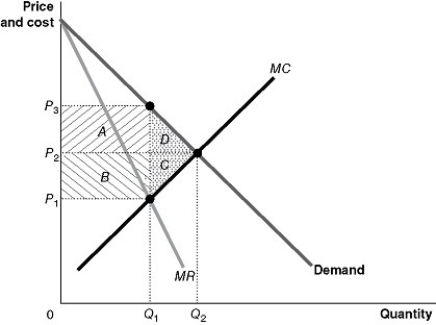 -Refer to Figure 15-14.From the monopoly graph above, identify the following:
a.The profit-maximizing price
b.The profit-maximizing quantity
c.The area representing deadweight loss
d.The area representing the transfer of consumer surplus to the monopoly
-Refer to Figure 15-14.From the monopoly graph above, identify the following:
a.The profit-maximizing price
b.The profit-maximizing quantity
c.The area representing deadweight loss
d.The area representing the transfer of consumer surplus to the monopoly
(Essay)
4.9/5 (32)
Filters
- Essay(0)
- Multiple Choice(0)
- Short Answer(0)
- True False(0)
- Matching(0)