Exam 21: The Theory of Consumer Choice
Exam 1: Ten Principles of Economics218 Questions
Exam 2: Thinking Like an Economist239 Questions
Exam 3: Interdependence and the Gains From Trade207 Questions
Exam 4: The Market Forces of Supply and Demand351 Questions
Exam 5: Elasticity and Its Application230 Questions
Exam 6: Supply, demand, and Government Policies248 Questions
Exam 7: Consumers, producers, and the Efficiency of Markets216 Questions
Exam 8: Application: the Costs of Taxation222 Questions
Exam 9: Application: International Trade182 Questions
Exam 10: Externalities210 Questions
Exam 11: Public Goods and Common Resources173 Questions
Exam 12: The Design of the Tax System200 Questions
Exam 13: The Costs of Production209 Questions
Exam 14: Firms in Competitive Markets261 Questions
Exam 15: Monopoly239 Questions
Exam 16: Monopolistic Competition191 Questions
Exam 17: Oligopoly198 Questions
Exam 18: The Markets for the Factors of Production180 Questions
Exam 19: Earnings and Discrimination167 Questions
Exam 20: Income Inequality and Poverty163 Questions
Exam 21: The Theory of Consumer Choice191 Questions
Exam 22: Frontiers of Microeconomics141 Questions
Select questions type
Figure 21-1
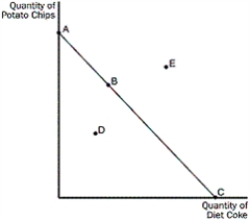 -Refer to Figure 21-1.At what point in the figure is a consumer choosing to spend less than her total income
(Multiple Choice)
4.8/5  (34)
(34)
Figure 21-3
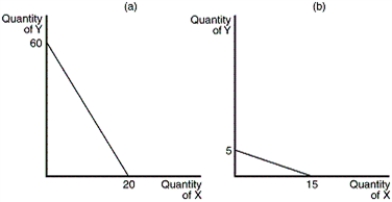 -Refer to Figure 21-3.Assume that a consumer faces both budget constraints in graph (a) and graph (b) on two different occasions.If her income has remained constant,what has happened to prices
(Multiple Choice)
4.7/5 (33)
Explain the difference between inferior and normal goods.As a developing economy experiences increases in income (measured by GDP),what would you predict to happen to demand for inferior goods
(Essay)
4.9/5 (32)
Given a consumer's indifference map,how may the demand curve for a good be derived
(Multiple Choice)
4.9/5 (47)
Table 21-1
The relationship between the marginal utility that George gets from eating a bag of cookies and the number of bags he eats per month is as follows:
 -Refer to Table 21-1.George consumes two goods,milk and cookies.He has maximized his utility given his income.Milk costs $2 per litre and he consumes it to the point where the marginal utility he receives from milk is 8.Cookies cost $5 per bag.How many bags of cookies does George buy each month
(Multiple Choice)
4.9/5 (41)
Figure 21-8
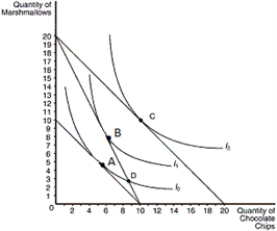 -Refer to Figure 21-8.Assume that the consumer depicted has an income of $50.Which price-quantity combination would be on her demand curve for marshmallows if the price of a bag of chocolate chips is $5
(Multiple Choice)
4.8/5 (29)
Assume that a person consumes two goods,coffee and candy bars.Use a graph to demonstrate how the consumer adjusts his/her optimal consumption bundle when the price of coffee decreases.Carefully label all curves and axes.What will happen to consumption if coffee is a normal good
What will happen to consumption if coffee is an inferior good
(Remember to explain the possible change when the income effect dominates and when the substitution effect dominates.)
(Essay)
4.9/5 (44)
Draw indifference curves that reflect the following:
a.pencils with white erasers and pencils with pink erasers
b.left shoes and right shoes
c.potatoes and rice
d.income and polluted water
(Essay)
4.8/5 (29)
What is the substitution effect from an increase in wages evident in
(Multiple Choice)
4.9/5 (39)
In which way will an increase in income cause a consumer's budget constraint to change
(Multiple Choice)
4.9/5 (29)
When leisure is a normal good,what is the income effect from an increase in wages evident in
(Multiple Choice)
4.8/5 (33)
Filters
- Essay(0)
- Multiple Choice(0)
- Short Answer(0)
- True False(0)
- Matching(0)