Exam 21: The Theory of Consumer Choice
Exam 1: Ten Principles of Economics218 Questions
Exam 2: Thinking Like an Economist239 Questions
Exam 3: Interdependence and the Gains From Trade207 Questions
Exam 4: The Market Forces of Supply and Demand351 Questions
Exam 5: Elasticity and Its Application230 Questions
Exam 6: Supply, demand, and Government Policies248 Questions
Exam 7: Consumers, producers, and the Efficiency of Markets216 Questions
Exam 8: Application: the Costs of Taxation222 Questions
Exam 9: Application: International Trade182 Questions
Exam 10: Externalities210 Questions
Exam 11: Public Goods and Common Resources173 Questions
Exam 12: The Design of the Tax System200 Questions
Exam 13: The Costs of Production209 Questions
Exam 14: Firms in Competitive Markets261 Questions
Exam 15: Monopoly239 Questions
Exam 16: Monopolistic Competition191 Questions
Exam 17: Oligopoly198 Questions
Exam 18: The Markets for the Factors of Production180 Questions
Exam 19: Earnings and Discrimination167 Questions
Exam 20: Income Inequality and Poverty163 Questions
Exam 21: The Theory of Consumer Choice191 Questions
Exam 22: Frontiers of Microeconomics141 Questions
Select questions type
Figure 21-9
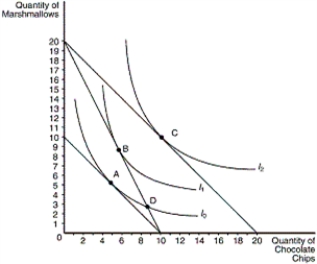 -Refer to Figure 21-9.If point B is the consumer's optimum and her income is $100,what is the price of a bag of chocolate chips
(Multiple Choice)
4.9/5  (35)
(35)
Using the graph shown,construct a demand curve for yogurt given an income of $10.

(Essay)
4.8/5 (23)
Figure 21-6
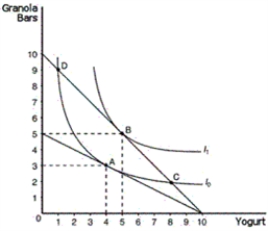 -Refer to Figure 21-6.Assume that the consumer depicted in the figure has an income of $20 to spend entirely on yogurt and granola bars.The price of a tub of yogurt is $2,and the price of a pack of granola bars is $2.This consumer will choose to optimize by consuming which bundle
(Multiple Choice)
4.8/5 (41)
Figure 21-3
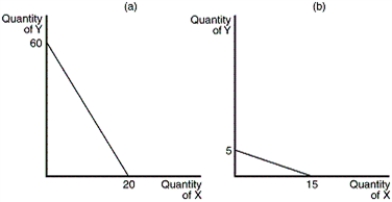 -Refer to Figure 21-3.In graph (b),what is the price of good X relative to good Y (i.e.,PX/PY)
(Multiple Choice)
4.8/5 (30)
A highly bowed inward set of indifference curves represents two goods which can be described as which of the following
(Multiple Choice)
4.8/5 (26)
Figure 21-1
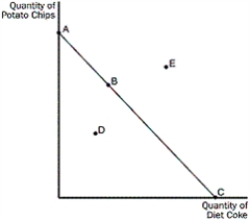 -Refer to Figure 21-1.What point does NOT represent a possible consumption option
(Multiple Choice)
4.8/5 (37)
What will a consumer buy if there is a shift outward in the budget constraint
(Multiple Choice)
4.8/5 (28)
Using indifference curves and budget constraints,graphically illustrate the substitution and income effects that would result from a change in the price of one good.
(Essay)
4.9/5 (42)
Lucy wants to go on a special diet to lose weight. The diet requires 1 serving of protein and 10 servings of vegetables/fruits per meal. Lucy has a budget of $900 per month on food items.
a. If the price for 1 serving of protein is $10 and 10 servings of vegetables/fruits is $20, how many meals will she buy?
b. If the price for 1 serving of protein changes to $5 and 10 servings of vegetables/fruits is $20, how many meals will she buy? What is the income and substitution effect after the price change?
(Essay)
4.7/5 (24)
Figure 21-3
-Refer to Figure 21-3.In graph (a),if income is equal to $180,what is the price of good Y
(Multiple Choice)
4.8/5 (30)
What can we say about a consumption bundle selected by an optimizing consumer
(Multiple Choice)
4.8/5 (33)
Which characterization is NOT applicable to the slope of the budget constraint
(Multiple Choice)
4.9/5 (27)
What does the bowed shape of the indifference curve reflect about the consumer's willingness
(Multiple Choice)
4.7/5 (35)
For normal goods like cola and pizza,what is a likely result of the income effect when the price of pizza falls
(Multiple Choice)
4.8/5 (34)
If goods X and Y are perfect complements,and the price of good Y falls,what are changes in the amount of goods X and Y purchased due to
(Multiple Choice)
4.7/5 (34)
As one moves down a typical indifference curve,how does the marginal rate of substitution change
(Multiple Choice)
4.7/5 (31)
The substitution effect of a price change is the change in consumption that results from the movement to a different indifference curve.
(True/False)
4.8/5 (34)
Figure 21-6
-Refer to Figure 21-6.Assume that the consumer depicted in the figure faces prices and income such that she optimizes at point B.According to the graph,what change forces the consumer to move to point A
(Multiple Choice)
4.8/5 (34)
What do economists studying the policy of taxation of interest and other capital income find
(Multiple Choice)
4.8/5 (36)
Filters
- Essay(0)
- Multiple Choice(0)
- Short Answer(0)
- True False(0)
- Matching(0)