Exam 7: Production, Inputs, and Cost: Building Blocks for Supply Analysis
Exam 1: What Is Economics232 Questions
Exam 2: The Economy: Myth and Reality155 Questions
Exam 3: The Fundamental Economic Problem: Scarcity and Choice255 Questions
Exam 4: Supply and Demand: an Initial Look313 Questions
Exam 5: Consumer Choice: Individual and Market Demand206 Questions
Exam 6: Demand and Elasticity214 Questions
Exam 7: Production, Inputs, and Cost: Building Blocks for Supply Analysis221 Questions
Exam 8: Output, Price, and Profit: the Importance of Marginal Analysis194 Questions
Exam 9: Securities: Business Finance and the Economy: the Tail That Wags the Dog203 Questions
Exam 10: The Firm and the Industry Under Perfect Competition212 Questions
Exam 11: Monopoly208 Questions
Exam 12: Between Competition and Monopoly230 Questions
Exam 13: Limiting Market Power: Regulation and Antitrust155 Questions
Exam 14: The Case for Free Markets: the Price System225 Questions
Exam 15: The Shortcomings of Free Markets219 Questions
Exam 16: Externalities, the Environment, and Natural Resources222 Questions
Exam 17: Taxation and Resource Allocation221 Questions
Exam 18: Pricing the Factors of Production233 Questions
Exam 19: Labor and Entrepreneurship: the Human Inputs271 Questions
Exam 20: Poverty, Inequality, and Discrimination172 Questions
Exam 21: Is Useconomic Leadership Threatened75 Questions
Exam 22: An Introduction to Macroeconomics216 Questions
Exam 23: The Goals of Macroeconomic Policy212 Questions
Exam 24: Economic Growth: Theory and Policy228 Questions
Exam 25: Aggregate Demand and the Powerful Consumer219 Questions
Exam 26: Demand-Side Equilibrium: Unemployment or Inflation216 Questions
Exam 27: Bringing in the Supply Side: Unemployment and Inflation228 Questions
Exam 28: Managing Aggregate Demand: Fiscal Policy210 Questions
Exam 29: Money and the Banking System224 Questions
Exam 30: Monetary Policy: Conventional and Unconventional210 Questions
Exam 31: He Financial Crisis and the Great Recession66 Questions
Exam 32: The Debate Over Monetary and Fiscal Policy219 Questions
Exam 33: Budget Deficits in the Short and Long Run215 Questions
Exam 34: The Trade-Off Between Inflation and Unemployment219 Questions
Exam 35: International Trade and Comparative Advantage223 Questions
Exam 36: The International Monetary System: Order or Disorder218 Questions
Exam 37: Exchange Rates and the Macroeconomy219 Questions
Select questions type
The different points on a cost curve represent alternative production possibilities in the same time period.
(True/False)
4.8/5  (40)
(40)
An airline industry study recently reported, "Evidence is abundant that larger firms are not more efficient or less costly simply because they are larger.In fact, other things equal, the largest carriers tend to have a higher level of unit costs, possibly caused by the difficulties of managing an airline of large size." This means that
(Multiple Choice)
4.9/5 (30)
Firms choose the highest indifference curve they can obtain given the lowest possible budget line.
(True/False)
4.9/5 (33)
If the price of one input changes, generally the firm will change its use of both inputs.
(True/False)
4.9/5 (39)
The least costly way to produce a given level of output is indicated by the point of tangency between a budget line and the production indifference curve corresponding to that level of output.
(True/False)
4.9/5 (29)
Graph typical total, average, and marginal cost curves and explain how their shapes are influenced by the law of diminishing returns.Graph TC on a separate graph, AC and MC on a second graph.
(Essay)
4.9/5 (32)
Figure 7-11
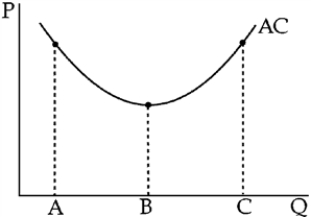 -Figure 7-11 shows an average cost curve with points on it that correspond to three quantity levels.Which of the following statements must be wrong?
(Multiple Choice)
4.8/5 (29)
Production costs for a given output will be minimized when the
(Multiple Choice)
4.8/5 (31)
Total physical product is maximized if marginal physical product is zero.
(True/False)
4.9/5 (38)
The least costly combination of inputs is influenced by the relative prices of inputs.
(True/False)
4.7/5 (35)
A rise in the price of an input can be expected to lead to a rise in its marginal physical product.
(True/False)
4.7/5 (34)
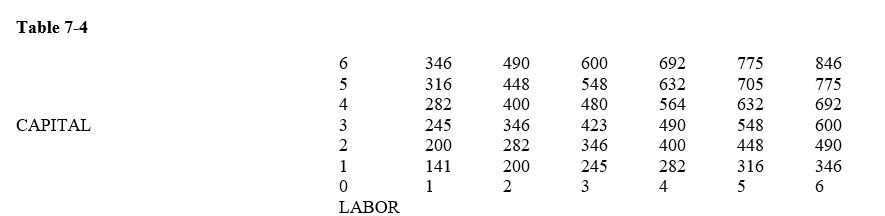 -The production relationship in Table 7-4 indicates a process characterized by
(Multiple Choice)
4.9/5 (36)
On Naomi's pig farm, Naomi hires all the labor used, grows all the grain fed to the pigs, and owns the barn.The costs used to calculate the total cost curve include
(Multiple Choice)
4.9/5 (36)
Filters
- Essay(0)
- Multiple Choice(0)
- Short Answer(0)
- True False(0)
- Matching(0)