Exam 5: Subtotals, Pivottables, and Pivotcharts
Exam 1: Introduction to Excel100 Questions
Exam 2: Formulas and Functions100 Questions
Exam 3: Charts100 Questions
Exam 4: Datasets and Tables100 Questions
Exam 5: Subtotals, Pivottables, and Pivotcharts100 Questions
Exam 6: What-If Analysis100 Questions
Exam 7: Specialized Functions100 Questions
Exam 8: Statistical Functions100 Questions
Exam 9: Multiple-Sheet Workbook Management98 Questions
Exam 10: Imports, Xml, and Power Add-Ins95 Questions
Exam 11: Collaboration and Workbook Distribution96 Questions
Exam 12: Templates, Styles, and Macros97 Questions
Exam 13: Appendix: Exploring Microsoft Office Excel 2016 Comprehensive Poatsygrauer115 Questions
Select questions type
In a PivotTable Fields task pane, the ________ filters the data to display results based on particular conditions you set.
(Short Answer)
4.8/5  (33)
(33)
Which of the following is not a valid method to remove a field from a PivotTable?
(Multiple Choice)
4.7/5 (25)
A PivotChart is similar to a regular chart, except it is based on the categories and structure of a(n)________.
(Short Answer)
4.8/5 (37)
Match each of the following subtotal functions to its best description:
Correct Answer: Verified
Premises:
Responses:
(Matching)
4.9/5 (36)
Match each of the following PivotChart terms to its related PivotTable term:
Correct Answer:Verified
Premises:
Responses:
(Matching)
4.9/5 (39)
Displaying subtotals at the top or bottom of a section is controlled on the PivotTable styles gallery.
(True/False)
4.9/5 (39)
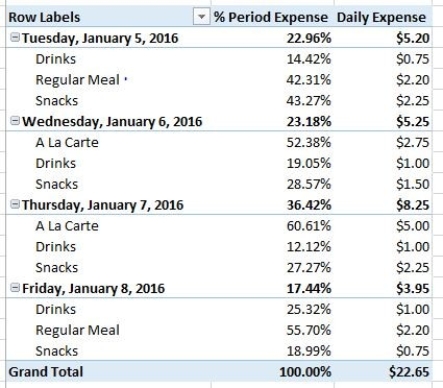
The % Period Expense Column on this PivotTable uses a % of Parent Row Total calculation option.
(True/False)
4.8/5 (44)
A worksheet of faculty members at your university contains these columns in this sequence: Rank, Last Name, First Name, Department, and Salary.What is the first step to subtotal departmental salaries?
(Multiple Choice)
4.8/5 (37)
PivotTables ________ or summarize large amounts of data for analysis
(Short Answer)
4.8/5 (30)
You have a PivotTable with 2 fields in the ROWS area and you want to see only the top level of categories.How do you hide the entire second level without removing it from the ROWS area?
(Multiple Choice)
4.8/5 (28)
A(n)________ is an interactive table which uses calculations to consolidate and summarize information.
(Multiple Choice)
4.8/5 (27)
________ Analysis is the built-in tool which automatically builds a recommended pivot table based on your dataset.
(Short Answer)
4.8/5 (40)
Match each of the following PivotTable summary statistic functions to its mathematical operator or explanation:
Correct Answer:Verified
Premises:
Responses:
(Matching)
4.9/5 (26)
Filters
- Essay(0)
- Multiple Choice(0)
- Short Answer(0)
- True False(0)
- Matching(0)