Exam 3: Income and Interest Rates: the Keynesian Cross Model and the Is Curve
Exam 1: What Is Macroeconomics71 Questions
Exam 2: The Measurement of Income,prices,and Unemployment104 Questions
Exam 3: Income and Interest Rates: the Keynesian Cross Model and the Is Curve167 Questions
Exam 4: Strong and Weak Policy Effects in the Is-Lm Model148 Questions
Exam 5: Financial Markets, financial Regulation, and Economic Instability52 Questions
Exam 6: The Government Budget, the Government Debt, and the Limitations of Fiscal Policy149 Questions
Exam 7: International Trade, exchange Rates, and Macroeconomic Policy156 Questions
Exam 8: Aggregate Demand, aggregate Supply, and the Great Depression155 Questions
Exam 9: Inflation: Its Causes and Cures191 Questions
Exam 10: The Goals of Stabilization Policy: Low Inflation and Low Unemployment132 Questions
Exam 11: The Theory of Economic Growth113 Questions
Exam 12: The Big Questions of Economic Growth74 Questions
Exam 13: Money,banks,and the Federal Reserve148 Questions
Exam 14: The Goals, tools, and Rules of Monetary Policy135 Questions
Exam 15: The Economics of Consumption Behavior103 Questions
Exam 16: The Economics of Investment Behavior111 Questions
Exam 17: New Classical Macro and New Keynesian Macro170 Questions
Exam 18: Conclusion: Where We Stand29 Questions
Select questions type
Figure 3-7
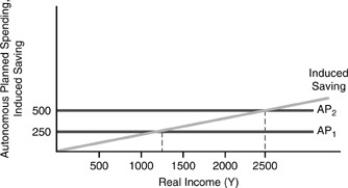 -In Figure 3-7 above,a $250 increase in AP causes
(Multiple Choice)
4.7/5  (27)
(27)
Figure 3-6
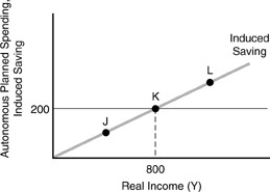 -In Figure 3-6 above,income and planned expenditure are equal at
(Multiple Choice)
4.8/5 (33)
If the MPS is 0.1 and the income tax rate is 0.33 the marginal leakage rate for a closed economy is
(Multiple Choice)
4.9/5 (40)
The IS curve plots for each level of income the ________ that causes income to equal ________.
(Multiple Choice)
5.0/5 (40)
In the simple Keynesian model of the determination of income,planned investment is
(Multiple Choice)
4.9/5 (35)
The one type of expenditure that we assume can differ from what spenders have planned is
(Multiple Choice)
4.8/5 (29)
Figure 3-7
-In Figure 3-7 above,if the natural real GDP is $2500,AP = $250,and the change in "a" = change in I = change in NX = 0,then the natural real GDP could be attained with a
(Multiple Choice)
4.9/5 (46)
If the expected earnings of an investment project exceed all expenses except interest payments,
(Multiple Choice)
4.8/5 (40)
Figure 3-1
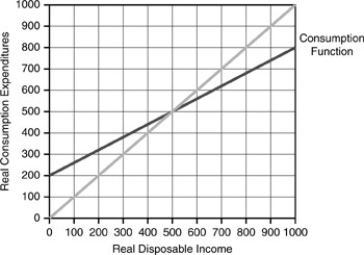 -Employing Figure 3-1 above,autonomous consumption expenditures are ________,and the marginal propensity to consume is ________.
(Multiple Choice)
4.8/5 (36)
During the worst of the Great Depression,in 1932 and 1933,disposable income was so low that it actually ________ aggregate consumption,so that aggregate saving became ________.
(Multiple Choice)
4.8/5 (48)
Should autonomous consumption fall by one dollar,the effect of this on equilibrium income can be offset if government expenditure
(Multiple Choice)
4.9/5 (41)
Which of the components of total planned autonomous spending has a negative multiplier,and one which is lower in absolute value than the multiplier of the others?
(Multiple Choice)
4.9/5 (38)
Figure 3-7
 -In Figure 3-7 above,the marginal propensity to save is
(Multiple Choice)
4.8/5 (27)
Since income tax revenues will rise (fall)as expenditures and output increase (decrease)the income tax results in
(Multiple Choice)
4.8/5 (41)
Figure 3-6
-In Figure 3-6 above,income and actual expenditures are equal at
(Multiple Choice)
4.7/5 (29)
Filters
- Essay(0)
- Multiple Choice(0)
- Short Answer(0)
- True False(0)
- Matching(0)