Exam 4: Efficiency in Resource Allocation: How Much Do We Have How Much Do We Want
Exam 1: Economic Growth: an Introduction to Scarcity and Choice89 Questions
Exam 2: An Introduction to Economic Systems and the Workings of the Price System94 Questions
Exam 3: Competitive Markets and Government Policy: Agriculture138 Questions
Exam 4: Efficiency in Resource Allocation: How Much Do We Have How Much Do We Want49 Questions
Exam 5: Market Power: Does It Help or Hurt the Economy93 Questions
Exam 6: Air Pollution: Balancing Benefits and Costs85 Questions
Exam 7: Health Care: How Much for Whom70 Questions
Exam 8: Crime and Drugs: a Modern Dilemma104 Questions
Exam 9: College Education: Is It Worth the Cost71 Questions
Exam 10: Educational Reform: the Role of Incentives and Choice79 Questions
Exam 11: Poverty: Old and New Approaches to a Persistent Problem96 Questions
Exam 12: Tracking and Explaining the Macroeconomy116 Questions
Exam 13: Unemployment: the Legacy of Recession, Technological Change, and Free Choice101 Questions
Exam 14: Inflation: a Monetary Phenomenon103 Questions
Exam 15: Sustained Budget Deficits: Is This Any Way to Run a Government84 Questions
Exam 16: Social Security: Leading Issues and Approaches to Reform65 Questions
Exam 17: International Trade: Beneficial, but Controversial88 Questions
Exam 18: Financing Trade and the Trade Deficit77 Questions
Select questions type
Income taxes result in allocative inefficiency because most people would work the same number of hours per year regardless of their hourly wage.
(True/False)
4.8/5  (38)
(38)
Suppose a market is currently producing at a point where marginal social benefit exceeds marginal cost. For efficiency, production should:
(Multiple Choice)
4.8/5 (36)
Allocative efficiency exists when net benefit is as large as possible.
(True/False)
4.7/5 (24)
Use the following diagram to answer the following questions.
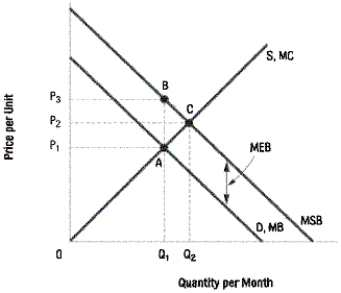 -Refer to Diagram 4-2. In the above diagram, the efficient price and quantity will be
(Multiple Choice)
4.8/5 (46)
Use the following diagram to answer the following questions.
 -Use the following diagram. The total net efficiency loss from government rent controls is given by area:
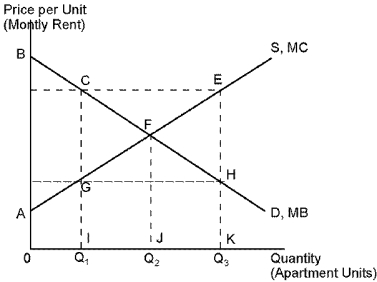
(Multiple Choice)
5.0/5 (38)
Use the following diagram to answer the following questions.
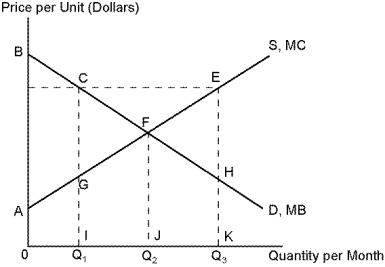 -Refer to Diagram 4-1. If production of compact discs is currently represented by quantity Q₁. The total cost of this production is given by area:
(Multiple Choice)
4.9/5 (39)
Use the following information to answer the following questions.
 -Refer to Bicycles. The marginal benefit of the fourth bicycle is:
(Multiple Choice)
4.8/5 (41)
Filters
- Essay(0)
- Multiple Choice(0)
- Short Answer(0)
- True False(0)
- Matching(0)