Exam 13: Aggregate Supply and Aggregate Demand
Exam 1: Getting Started350 Questions
Exam 2: The Usand Global Economies199 Questions
Exam 3: The Economic Problem271 Questions
Exam 4: Demand and Supply317 Questions
Exam 5: Gdp: a Measure of Total Production and Income254 Questions
Exam 6: Jobs and Unemployment343 Questions
Exam 7: The Cpi and the Cost of Living265 Questions
Exam 8: Potential Gdp and the Natural Unemployment Rate207 Questions
Exam 9: Economic Growth267 Questions
Exam 10: Finance, Saving, and Investment269 Questions
Exam 11: The Monetary System361 Questions
Exam 12: Money, Interest, and Inflation261 Questions
Exam 13: Aggregate Supply and Aggregate Demand272 Questions
Exam 14: Aggregate Expenditure Multiplier311 Questions
Exam 15: The Short-Run Policy Tradeoff208 Questions
Exam 16: Fiscal Policy203 Questions
Exam 17: Monetary Policy188 Questions
Exam 18: International Trade Policy218 Questions
Exam 19: International Finance255 Questions
Select questions type
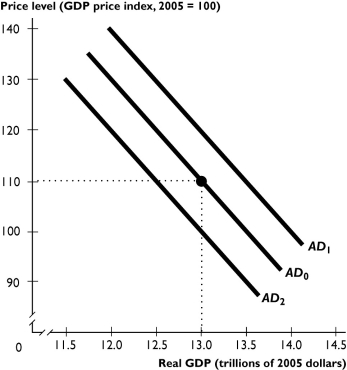 The figure above shows aggregate demand curves.
-Based on the figure above, the aggregate demand curve will shift from AD₀ to AD₁ when
The figure above shows aggregate demand curves.
-Based on the figure above, the aggregate demand curve will shift from AD₀ to AD₁ when
(Multiple Choice)
4.9/5  (43)
(43)
Assume the equilibrium price level is 140 and the equilibrium real GDP is $15 trillion.What happens if the current price level equals 125?
(Essay)
4.8/5 (22)
A fall in the real wage rate ________ firms' profits and leads to ________ in the quantity supplied.
(Multiple Choice)
4.7/5 (27)
If the quantity of real GDP supplied equals the quantity of real GDP demanded, then
(Multiple Choice)
4.9/5 (33)
A fall in the price level produces a ________ the aggregate demand curve.
(Multiple Choice)
4.7/5 (45)
A rise in the price level brings a ________ in the real wage rate that ________ profits which leads to ________ production.
(Multiple Choice)
4.9/5 (44)
An economy experiences a recessionary gap.As a result, the money wage rate
(Multiple Choice)
4.8/5 (37)
The economy is at full employment.If aggregate demand increases,
(Multiple Choice)
4.7/5 (43)
A fall in the price level brings a ________ in the real wage rate that ________ profits which leads to ________.
(Multiple Choice)
4.8/5 (35)
An economy is at a full-employment equilibrium, and then the aggregate demand curve shifts leftward.As a result, the price level ________ and real GDP ________.
(Multiple Choice)
4.9/5 (35)
As a result of OPEC ________ oil prices in 1973 and 1980, real GDP in United States ________.
(Multiple Choice)
4.9/5 (37)
Which of the following does NOT shift the aggregate demand curve?
(Multiple Choice)
4.8/5 (40)
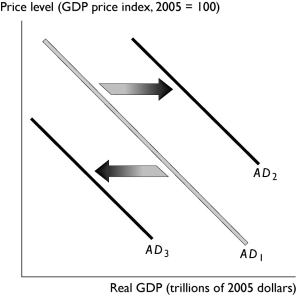 -In the figure above, the shift in the aggregate demand curve from AD₁ to AD₃ could be the result of
(Multiple Choice)
4.7/5 (36)
Which of the following shifts the aggregate supply curve leftward?
(Multiple Choice)
4.9/5 (34)
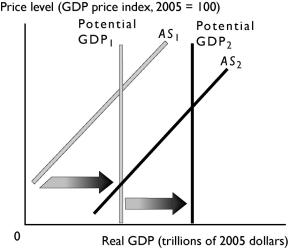 -The change in potential real GDP and aggregate supply shown in the graph above can be a result of
(Multiple Choice)
4.8/5 (32)
How does a recession in Asia affect U.S.aggregate demand and the U.S.aggregate demand curve?
(Essay)
4.8/5 (43)
Filters
- Essay(0)
- Multiple Choice(0)
- Short Answer(0)
- True False(0)
- Matching(0)