Exam 13: Aggregate Supply and Aggregate Demand
Exam 1: Getting Started350 Questions
Exam 2: The Usand Global Economies199 Questions
Exam 3: The Economic Problem271 Questions
Exam 4: Demand and Supply317 Questions
Exam 5: Gdp: a Measure of Total Production and Income254 Questions
Exam 6: Jobs and Unemployment343 Questions
Exam 7: The Cpi and the Cost of Living265 Questions
Exam 8: Potential Gdp and the Natural Unemployment Rate207 Questions
Exam 9: Economic Growth267 Questions
Exam 10: Finance, Saving, and Investment269 Questions
Exam 11: The Monetary System361 Questions
Exam 12: Money, Interest, and Inflation261 Questions
Exam 13: Aggregate Supply and Aggregate Demand272 Questions
Exam 14: Aggregate Expenditure Multiplier311 Questions
Exam 15: The Short-Run Policy Tradeoff208 Questions
Exam 16: Fiscal Policy203 Questions
Exam 17: Monetary Policy188 Questions
Exam 18: International Trade Policy218 Questions
Exam 19: International Finance255 Questions
Select questions type
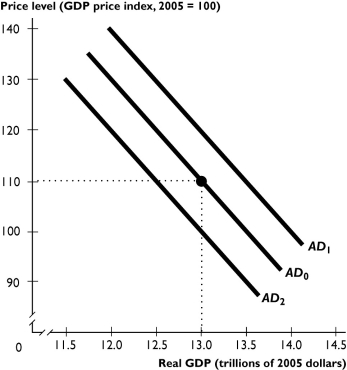 The figure above shows aggregate demand curves.
-Based on the figure above, the aggregate demand curve will shift from AD₀ to AD₂ when
The figure above shows aggregate demand curves.
-Based on the figure above, the aggregate demand curve will shift from AD₀ to AD₂ when
(Multiple Choice)
4.9/5  (37)
(37)
Which of the following shifts the aggregate supply curve rightward?
(Multiple Choice)
4.8/5 (37)
Which of the following changes aggregate supply and shifts the aggregate supply curve?
i. change in the price level
ii. change in potential GDP
iii. change in the money wage rate
(Multiple Choice)
4.8/5 (30)
An increase in the price level ________ the aggregate quantity supplied and ________ the aggregate quantity demanded.
(Multiple Choice)
4.8/5 (30)
Which of the following decreases aggregate demand and shifts the AD curve leftward?
(Multiple Choice)
4.7/5 (35)
In the short run, a rise in the price level brings a ________ in the real interest rate that ________ investment, bringing ________ in the quantity of real GDP demanded.
(Multiple Choice)
4.9/5 (39)
The quantity of real GDP supplied decreases if the price level ________ because it ________ profits.
(Multiple Choice)
4.9/5 (40)
When the price level rises and increases the demand for money, the nominal interest rate ________ and the real interest rate ________.
(Multiple Choice)
4.8/5 (41)
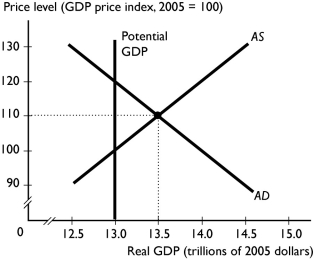 -In the figure above, the economy is at an equilibrium with real GDP of $10 trillion and a price level of 110.As the economy moves toward its ultimate equilibrium, the ________ curve will shift ________.
(Multiple Choice)
4.8/5 (29)
Other things remaining the same, an increase in the price level
(Multiple Choice)
4.9/5 (38)
Price level (GDP deflator) Potential GDP (billions of 2005 dollars) Real GDP supplied (billions of 2005 dollars) Real GDP demanded (billions of 2005 dollars) 150 25 34 16 140 25 31 19 130 25 28 22 120 25 25 25 110 25 23 28
-The table above gives data for the nation of Pearl, a small island in the South Pacific.If aggregate demand increases so that the quantity of real GDP demanded is $6 billion more at each price level, the new equilibrium real GDP is
(Multiple Choice)
4.9/5 (38)
A technological advance ________ aggregate supply, shifting the aggregate supply curve ________ and potentially bringing the ________ phase of the business cycle.
(Multiple Choice)
4.9/5 (34)
Filters
- Essay(0)
- Multiple Choice(0)
- Short Answer(0)
- True False(0)
- Matching(0)