Exam 4: A : Supply and Demand: Applications and Extensions
Exam 1: The Economic Approach210 Questions
Exam 2: A : Some Tools of the Economist224 Questions
Exam 2: B : Some Tools of the Economist33 Questions
Exam 3: A : Supply, Demand, and the Market Process225 Questions
Exam 3: B : Supply, Demand, and the Market Process180 Questions
Exam 4: A : Supply and Demand: Applications and Extensions233 Questions
Exam 4: B : Supply and Demand: Applications and Extensions98 Questions
Exam 5: Difficult Cases for the Market and the Role of Government168 Questions
Exam 6: The Economics of Collective Decision-Making180 Questions
Exam 7: A : Taking the Nations Economic Pulse238 Questions
Exam 7: B : Taking the Nations Economic Pulse50 Questions
Exam 8: Economic Fluctuations, Unemployment, and Inflation242 Questions
Exam 9: A : an Introduction to Basic Macroeconomic Markets237 Questions
Exam 9: B : an Introduction to Basic Macroeconomic Markets24 Questions
Exam 10: Dynamic Change, Economic Fluctuations, and the Ad-As Model224 Questions
Exam 11: Fiscal Policy: the Keynesian View and Historical Perspective139 Questions
Exam 12: Fiscal Policy, Incentives, and Secondary Effects171 Questions
Exam 13: A : Money and the Banking System250 Questions
Exam 13: B : Money and the Banking System10 Questions
Exam 14: Modern Macroeconomics and Monetary Policy220 Questions
Exam 15: Stabilization Policy, Output, and Employment177 Questions
Exam 16: Creating an Environment for Growth and Prosperity142 Questions
Exam 17: Institutions, Policies, and Cross-Country Differences in Income and Growth153 Questions
Exam 18: Gaining From International Trade222 Questions
Exam 19: International Finance and the Foreign Exchange Market162 Questions
Exam 20: Consumer Choice and Elasticity223 Questions
Exam 21: A : Costs and the Supply of Goods223 Questions
Exam 21: B : Costs and the Supply of Goods8 Questions
Exam 22: A : Price Takers and the Competitive Process237 Questions
Exam 22: B : Price Takers and the Competitive Process23 Questions
Exam 23: Price-Searcher Markets With Low Entry Barriers216 Questions
Exam 24: A : Price-Searcher Markets With High Entry Barriers229 Questions
Exam 24: B : Price-Searcher Markets With High Entry Barriers25 Questions
Exam 25: The Supply of and Demand for Productive Resources200 Questions
Exam 26: Earnings, Productivity, and the Job Market109 Questions
Exam 27: Investment, the Capital Market, and the Wealth of Nations129 Questions
Exam 28: Income Inequality and Poverty136 Questions
Special Topic 1 : Government Spending and Taxation79 Questions
Special Topic 2 : The Economics of Social Security54 Questions
Special Topic 3 : The Stock Market: Its Function, Performance, and Potential as an Investment Opportunity70 Questions
Special Topic 4 : Great Debates in Economics: Keynes Versus Hayek8 Questions
Special Topic 5 : The Crisis of 2008: Causes and Lessons for the Future64 Questions
Special Topic 6 : Lessons from the Great Depression60 Questions
Special Topic 7 : Lessons from Japan and Canada72 Questions
Special Topic 8 : The Federal Budget and the National Debt97 Questions
Special Topic 9 : The Economics of Healthcare68 Questions
Special Topic 10 : Education: Problems and Performance60 Questions
Special Topic 11 : Earnings Differences Between Men and Women47 Questions
Special Topic 12 : Do Labor Unions Increase the Wages of Workers?74 Questions
Special Topic 13 : The Question of Resource Exhaustion61 Questions
Special Topic 14 : Difficult Environmental Cases and the Role of Government63 Questions
Select questions type
A price ceiling set below an equilibrium price tends to cause persistent imbalances in the market because
(Multiple Choice)
4.8/5  (40)
(40)
If Neleh's income increases from $60,000 to $80,000 and her tax liability increases from $12,000 to $16,000, which of the following is true?
(Multiple Choice)
4.8/5 (36)
If a local government enacts rent control legislation that sets the price of rental housing below equilibrium, which of the following will most likely happen in the local rental housing market?
(Multiple Choice)
4.9/5 (41)
Which of the following generalizations about the benefit of a subsidy is correct?
(Multiple Choice)
4.9/5 (33)
Use the table below to choose the correct answer.  The marginal tax rate on income in the $25,000 to $30,000 range is
(Multiple Choice)
4.8/5 (32)
Other things constant, if a labor union is able to successfully increase the wages of autoworkers, there will be
(Multiple Choice)
4.9/5 (25)
Use the figure below to answer the following question(s).
Figure 4-9
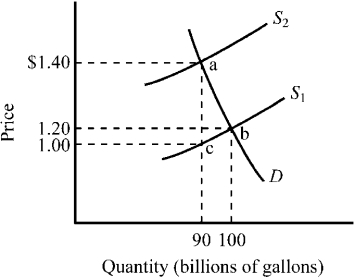 -Refer to Figure 4-9. The market for gasoline was initially in equilibrium at point b and a $.40 excise tax is illustrated. How much revenue would the $.40 gasoline tax raise?
(Multiple Choice)
4.8/5 (40)
Use the figure below to answer the following question(s).
Figure 4-13
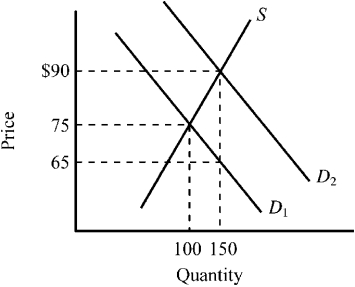 -Refer to Figure 4-13. The supply curve S and the demand curve D₁ indicate initial conditions in the market for flu shots. A new government program is implemented that grants buyers a $25 subsidy when they buy a flu shot, shifting the demand curve from D₁ to D₂. Which of the following is true for this subsidy given the information provided in the figure?
(Multiple Choice)
4.8/5 (44)
When a government subsidy is granted to the sellers of a product, buyers can end up capturing some of the benefit because
(Multiple Choice)
4.9/5 (26)
If Heather's tax liability increases from $10,000 to $16,000 when her income increases from $30,000 to $40,000, her marginal tax rate is
(Multiple Choice)
4.8/5 (31)
Figure 4-3
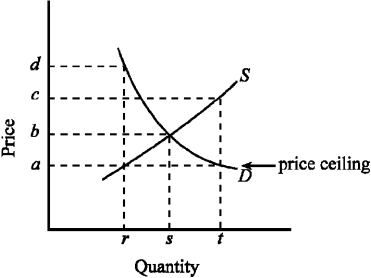 -Figure 4-3 indicates the demand (D) and supply (S) for the rental housing market in a large city. If the government imposed a price ceiling of a, which of the following would be true?
(Multiple Choice)
4.9/5 (41)
Suppose the market equilibrium price of wheat is $5 per bushel, and the government sets a price floor of $7 per bushel to aid growers. What is the most likely result of this action?
(Multiple Choice)
4.9/5 (41)
Suppose an excise tax is imposed on two products X and Y, both of which have identical supply elasticities. The demand for good X is highly elastic, while the demand for good Y is highly inelastic. The deadweight loss (or excess burden) will be
(Multiple Choice)
4.8/5 (35)
Other things constant, as the price of a resource increases,
(Multiple Choice)
4.9/5 (33)
Use the figure below illustrating the impact of an excise tax to answer the following question(s).
Figure 4-6
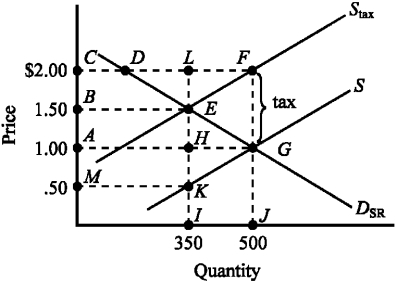 -The deadweight loss of the tax illustrated in Figure 4-6 is given by the area
(Multiple Choice)
4.9/5 (37)
When the top marginal tax rates were lowered substantially during the 1980s, the inflation-adjusted income tax revenue collected from the top 1 percent of all income earners
(Multiple Choice)
4.8/5 (36)
Use the figure below to answer the following question(s).
Figure 4-13
-Refer to Figure 4-13. The supply curve S and the demand curve D₁ indicate initial conditions in the market for flu shots. A new government program is implemented that grants buyers a $25 subsidy when they buy a flu shot, shifting the demand curve from D₁ to D₂. Which of the following is true for this subsidy given the information provided in the exhibit?
(Multiple Choice)
4.9/5 (43)
Filters
- Essay(0)
- Multiple Choice(0)
- Short Answer(0)
- True False(0)
- Matching(0)