Exam 4: A : Supply and Demand: Applications and Extensions
Exam 1: The Economic Approach210 Questions
Exam 2: A : Some Tools of the Economist224 Questions
Exam 2: B : Some Tools of the Economist33 Questions
Exam 3: A : Supply, Demand, and the Market Process225 Questions
Exam 3: B : Supply, Demand, and the Market Process180 Questions
Exam 4: A : Supply and Demand: Applications and Extensions233 Questions
Exam 4: B : Supply and Demand: Applications and Extensions98 Questions
Exam 5: Difficult Cases for the Market and the Role of Government168 Questions
Exam 6: The Economics of Collective Decision-Making180 Questions
Exam 7: A : Taking the Nations Economic Pulse238 Questions
Exam 7: B : Taking the Nations Economic Pulse50 Questions
Exam 8: Economic Fluctuations, Unemployment, and Inflation242 Questions
Exam 9: A : an Introduction to Basic Macroeconomic Markets237 Questions
Exam 9: B : an Introduction to Basic Macroeconomic Markets24 Questions
Exam 10: Dynamic Change, Economic Fluctuations, and the Ad-As Model224 Questions
Exam 11: Fiscal Policy: the Keynesian View and Historical Perspective139 Questions
Exam 12: Fiscal Policy, Incentives, and Secondary Effects171 Questions
Exam 13: A : Money and the Banking System250 Questions
Exam 13: B : Money and the Banking System10 Questions
Exam 14: Modern Macroeconomics and Monetary Policy220 Questions
Exam 15: Stabilization Policy, Output, and Employment177 Questions
Exam 16: Creating an Environment for Growth and Prosperity142 Questions
Exam 17: Institutions, Policies, and Cross-Country Differences in Income and Growth153 Questions
Exam 18: Gaining From International Trade222 Questions
Exam 19: International Finance and the Foreign Exchange Market162 Questions
Exam 20: Consumer Choice and Elasticity223 Questions
Exam 21: A : Costs and the Supply of Goods223 Questions
Exam 21: B : Costs and the Supply of Goods8 Questions
Exam 22: A : Price Takers and the Competitive Process237 Questions
Exam 22: B : Price Takers and the Competitive Process23 Questions
Exam 23: Price-Searcher Markets With Low Entry Barriers216 Questions
Exam 24: A : Price-Searcher Markets With High Entry Barriers229 Questions
Exam 24: B : Price-Searcher Markets With High Entry Barriers25 Questions
Exam 25: The Supply of and Demand for Productive Resources200 Questions
Exam 26: Earnings, Productivity, and the Job Market109 Questions
Exam 27: Investment, the Capital Market, and the Wealth of Nations129 Questions
Exam 28: Income Inequality and Poverty136 Questions
Special Topic 1 : Government Spending and Taxation79 Questions
Special Topic 2 : The Economics of Social Security54 Questions
Special Topic 3 : The Stock Market: Its Function, Performance, and Potential as an Investment Opportunity70 Questions
Special Topic 4 : Great Debates in Economics: Keynes Versus Hayek8 Questions
Special Topic 5 : The Crisis of 2008: Causes and Lessons for the Future64 Questions
Special Topic 6 : Lessons from the Great Depression60 Questions
Special Topic 7 : Lessons from Japan and Canada72 Questions
Special Topic 8 : The Federal Budget and the National Debt97 Questions
Special Topic 9 : The Economics of Healthcare68 Questions
Special Topic 10 : Education: Problems and Performance60 Questions
Special Topic 11 : Earnings Differences Between Men and Women47 Questions
Special Topic 12 : Do Labor Unions Increase the Wages of Workers?74 Questions
Special Topic 13 : The Question of Resource Exhaustion61 Questions
Special Topic 14 : Difficult Environmental Cases and the Role of Government63 Questions
Select questions type
Use the figure below to answer the following question(s).
Figure 4-11
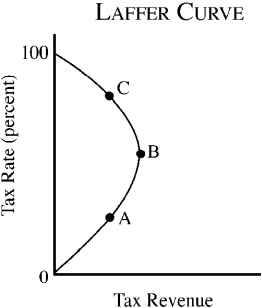 -Refer to Figure 4-11. On the Laffer curve shown, tax revenue could be increased by
(Multiple Choice)
4.8/5  (39)
(39)
A price ceiling that sets the price of a good below market equilibrium will cause
(Multiple Choice)
4.8/5 (45)
Which of the following generalizations about the burden of an excise tax is correct?
(Multiple Choice)
4.9/5 (42)
Which one of the following will most likely be harmed by legislation exempting teenagers from the minimum wage?
(Multiple Choice)
4.8/5 (35)
If Lex's income increases from $30,000 to $40,000 and his tax liability increases from $6,000 to $10,000, which of the following is true?
(Multiple Choice)
4.8/5 (37)
Use the figure below to answer the following question(s).
Figure 4-9
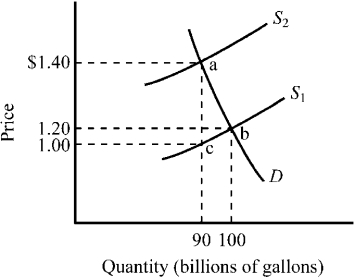 -Refer to Figure 4-9. The market for gasoline was initially in equilibrium at point b and a $.40 excise tax is illustrated. What does the triangular area abc represent?
(Multiple Choice)
4.9/5 (46)
If Heather's tax liability increases from $10,000 to $15,000 when her income increases from $30,000 to $40,000, her marginal tax rate is
(Multiple Choice)
4.8/5 (41)
Other things constant, how will a decrease in the wages of teenagers affect the market for fast food hamburgers?
(Multiple Choice)
5.0/5 (44)
In the supply and demand model, a subsidy granted to buyers is illustrated by
(Multiple Choice)
4.9/5 (47)
A price floor that sets the price of a good above market equilibrium will cause
(Multiple Choice)
4.8/5 (42)
Use the table below to choose the correct answer.  For the income range illustrated, the tax shown here is
(Multiple Choice)
4.8/5 (35)
In the two decades following 1990, subsidized federal loans per full-time student more than tripled. Economic analysis indicates that this expansion in subsidies
(Multiple Choice)
4.8/5 (39)
When a subsidy program allocates subsidies to a subset of the population, the result is greater demand and higher prices in the market where purchases are subsidized, raising costs for
(Multiple Choice)
4.9/5 (44)
If the supply of health care services is highly inelastic, programs that subsidize the cost of purchasing medical services will
(Multiple Choice)
4.8/5 (40)
Figure 4-1
 -Figure 4-1 illustrates the market for compact discs. If the government imposes a price floor of $25 for compact discs, which of the following will be true?
(Multiple Choice)
4.9/5 (29)
Filters
- Essay(0)
- Multiple Choice(0)
- Short Answer(0)
- True False(0)
- Matching(0)