Exam 4: Demand and Behavior in Markets
Exam 1: Economics and Institutions: a Shift of Emphasis40 Questions
Exam 2: Consumers and Their Preferences40 Questions
Exam 3: Utilities Indifference Curves40 Questions
Exam 4: Demand and Behavior in Markets40 Questions
Exam 5: Some Applications of Consumer Demand, and Welfare Analysis40 Questions
Exam 6: Uncertainty and the Emergence of Insurance40 Questions
Exam 7: Uncertainty Applications and Criticisms40 Questions
Exam 8: The Discovery of Production and Its Technology40 Questions
Exam 9: Cost and Choice39 Questions
Exam 10: Cost Curves40 Questions
Exam 11: Game Theory and the Tools of Strategic Business Analysis39 Questions
Exam 12: Decision Making Over Time39 Questions
Exam 13: The Internal Organization of the Firm39 Questions
Exam 14: Perfectly Competitive Markets: Short-Run Analysis40 Questions
Exam 15: Competitive Markets in the Long Run40 Questions
Exam 16: Market Institutions and Auctions40 Questions
Exam 17: The Age of Entrepreneurship: Monopoly40 Questions
Exam 18: Natural Monopoly and the Economics of Regulation40 Questions
Exam 19: The World of Oligopoly: Preliminaries to Successful Entry39 Questions
Exam 20: Market Entry and the Emergence of Perfect Competition40 Questions
Exam 21: The Problem of Exchange40 Questions
Exam 22: General Equilibrium and the Origins of the Free Market and Interventionist Ideologies40 Questions
Exam 23: Moral Hazard and Adverse Selection: Informational Market Failures40 Questions
Exam 24: Externalities: the Free Market Interventionist Battle Continues40 Questions
Exam 25: Public Goods, the Consequences of Strategic Voting Behavior, and the Role of Government40 Questions
Exam 26: Input Markets and the Origins of Class Conflict40 Questions
Select questions type
A demand curve represents graphically the relationship between the quantity of a good demanded by a consumer and the
(Multiple Choice)
4.7/5  (39)
(39)
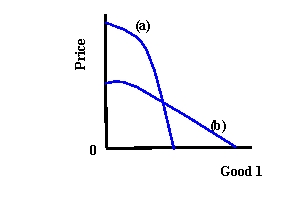 -Refer to Exhibit 4-4. Which curve represents the compensated demand function?
(Multiple Choice)
4.8/5 (33)
The primary difference between compensated and uncompensated demand functions is the presence or absence of the income effect that results from price changes.
(True/False)
4.8/5 (37)
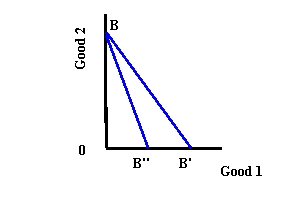 -Refer to Exhibit 4-3. The budget line rotates from BB" to BB' because the price of good 1
(Multiple Choice)
4.8/5 (38)
-Refer to Exhibit 4-4. Which curve represents the uncompensated demand function?
(Multiple Choice)
4.8/5 (33)
Markets in which the identity of the traders and their size in the market do not affect the price at which they trade are called
(Multiple Choice)
4.8/5 (39)
The ratio that tells how much a consumer in a market would have to forgo of one good in order to receive units of another good is called relative prices.
(True/False)
4.7/5 (36)
A good for which demand increases as the income of the consumer increases and the relative prices remain constant is called a(n)
(Multiple Choice)
5.0/5 (38)
-Refer to Exhibit 4-3. The budget line rotates from BB' to BB" because the price of good 1
(Multiple Choice)
4.9/5 (33)
Will the income effect always cause an increase in the quantity demanded?
(Essay)
4.8/5 (42)
The path connecting optimal consumption bundles that shows how a consumer changes the quantity demanded of specified goods as income changes and prices remain constant is called the
(Multiple Choice)
4.8/5 (31)
If a demand curve has flat segments, the agent most likely has
(Multiple Choice)
4.8/5 (38)
Filters
- Essay(0)
- Multiple Choice(0)
- Short Answer(0)
- True False(0)
- Matching(0)