Exam 10: Aggregate Supply and Aggregate Demand
Exam 1: What Is Economics479 Questions
Exam 2: The Economic Problem439 Questions
Exam 3: Demand and Supply515 Questions
Exam 4: Measuring GDP and Economic Growth396 Questions
Exam 5: Monitoring Jobs and Inflation407 Questions
Exam 6: Economic Growth353 Questions
Exam 7: Finance, Saving, and Investment240 Questions
Exam 8: Money, The Price Level, and Inflation583 Questions
Exam 9: The Exchange Rate and the Balance of Payments481 Questions
Exam 10: Aggregate Supply and Aggregate Demand418 Questions
Exam 11: Expenditure Multipliers454 Questions
Exam 12: Inflation, Jobs, and the Business Cycle401 Questions
Exam 13: Fiscal Policy263 Questions
Exam 14: Monetary Policy225 Questions
Exam 15: International Trade Policy197 Questions
Exam 16: Introduction23 Questions
Exam 17: Monitoring Macroeconomic Performance11 Questions
Exam 18: Macroeconomic Trends19 Questions
Exam 19: Macroeconomic Fluctuations23 Questions
Exam 20: Macroeconomic Policy25 Questions
Select questions type
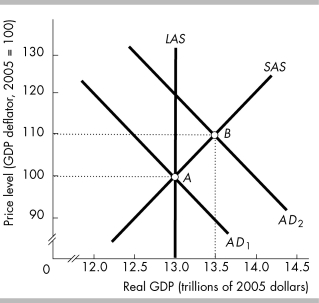 -In the above figure,the shift from AD₁ to AD₂ might have been the result of
(Multiple Choice)
4.8/5  (34)
(34)
Last year in the country of Union,the price level increased and real GDP increased.Such an outcome might have occurred because short-run aggregate supply ________ and aggregate demand ________.
(Multiple Choice)
4.9/5 (36)
In the short run,firms expand their production when the price level rises because
(Multiple Choice)
4.8/5 (36)
Price level Aggregate demand (trillions of 2005 dollars) Short-run aggregate supply (trillions of 2005 dollars) Long-run aggregate supply (trillions of 2005 dollars) 140 4 8 7 130 5 7 7 120 6 6 7 110 7 5 7 100 8 4 7
-The data in the above table show that when the price level is 120,if aggregate demand does not change then the
(Multiple Choice)
4.8/5 (35)
Price level Aggregate demand (trillions of 2005 dollars) Short-run aggregate supply (trillions of 2005 dollars) Long-run aggregate supply (trillions of 2005 dollars) 140 4 8 7 130 5 7 7 120 6 6 7 110 7 5 7 100 8 4 7
-The data in the above table show that when the price level is 120,the economy
(Multiple Choice)
4.9/5 (30)
The short-run aggregate supply curve is upward sloping because
(Multiple Choice)
4.9/5 (34)
Substitution effects help explain the slope of the aggregate demand curve.One substitution effect refers to the
(Multiple Choice)
4.9/5 (30)
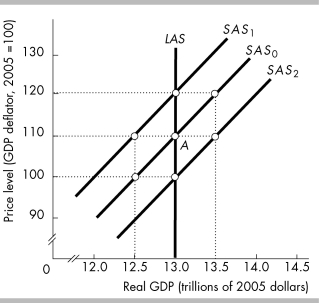 -In the above figure,the economy is at point A when the money wage rate and the price level both fall by 10 percent.Firms will be willing to supply output equal to
(Multiple Choice)
4.7/5 (36)
 -In the above figure,which movement illustrates the impact of a falling price level and a constant money wage rate?
(Multiple Choice)
4.9/5 (41)
Based on the figure above,short-run equilibrium occurs at the price level of
(Multiple Choice)
4.8/5 (34)
People expect that the El Nino effect will cause drought in Australia in coming years.If most Australian firms expect their profits will fall during the next five years,Australia's ________ this year.
(Multiple Choice)
4.8/5 (35)
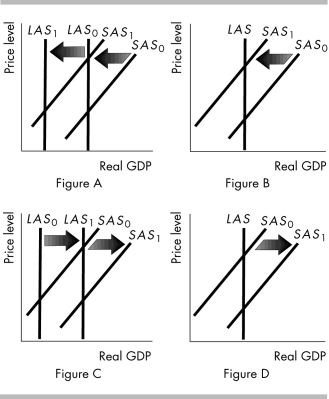
Which of the following shifts both the LAS and SAS curves?
(Multiple Choice)
4.8/5 (43)
If you have $5,000 in wealth and the price level decreases 20 percent,then
(Multiple Choice)
4.7/5 (36)
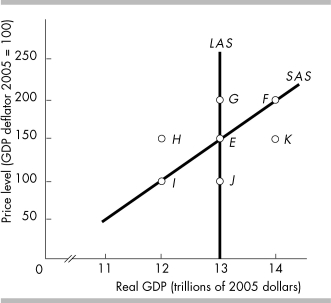
 -In the above figure,which point corresponds to an increase in technology?
(Multiple Choice)
4.8/5 (34)
Filters
- Essay(0)
- Multiple Choice(0)
- Short Answer(0)
- True False(0)
- Matching(0)