Exam 10: Aggregate Supply and Aggregate Demand
Exam 1: What Is Economics479 Questions
Exam 2: The Economic Problem439 Questions
Exam 3: Demand and Supply515 Questions
Exam 4: Measuring GDP and Economic Growth396 Questions
Exam 5: Monitoring Jobs and Inflation407 Questions
Exam 6: Economic Growth353 Questions
Exam 7: Finance, Saving, and Investment240 Questions
Exam 8: Money, The Price Level, and Inflation583 Questions
Exam 9: The Exchange Rate and the Balance of Payments481 Questions
Exam 10: Aggregate Supply and Aggregate Demand418 Questions
Exam 11: Expenditure Multipliers454 Questions
Exam 12: Inflation, Jobs, and the Business Cycle401 Questions
Exam 13: Fiscal Policy263 Questions
Exam 14: Monetary Policy225 Questions
Exam 15: International Trade Policy197 Questions
Exam 16: Introduction23 Questions
Exam 17: Monitoring Macroeconomic Performance11 Questions
Exam 18: Macroeconomic Trends19 Questions
Exam 19: Macroeconomic Fluctuations23 Questions
Exam 20: Macroeconomic Policy25 Questions
Select questions type
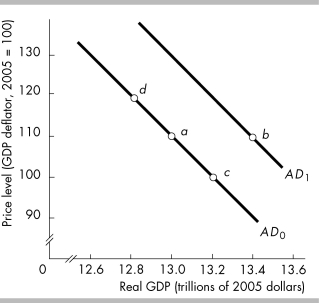 -In the above figure,if the economy is at point a,an increase in ________ will move the economy to ________.
(Multiple Choice)
4.9/5  (37)
(37)
In 2008,Japan's government approved a $1 trillion fiscal stimulus plan comprised of both tax cuts and government expenditure increases. As a result,
(Multiple Choice)
4.7/5 (29)
There are several reasons why the aggregate demand curve is downward sloping.Which of the following correctly describes one of these explanations?
(Multiple Choice)
4.8/5 (32)
A decrease in government expenditure shifts the AD curve ________ and a decrease in taxes shifts the AD curve ________.
(Multiple Choice)
4.8/5 (31)
In the first half of 2008,food and energy costs in the United States increased.At the same time,the financial crisis slowed production. As a result,economists warned that the economy would
(Multiple Choice)
4.8/5 (36)
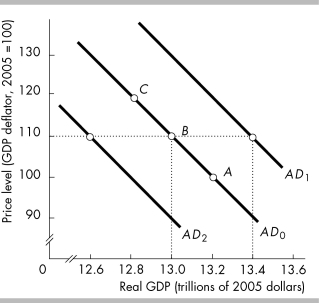 -In the above figure,the economy is initially at point B.If the Fed decreases the quantity of money,there is
(Multiple Choice)
4.8/5 (35)
Which of the following does NOT shift the aggregate demand curve?
(Multiple Choice)
4.9/5 (30)
What happens to the aggregate demand curve in the United States if the exchange rate increases so that U.S.-made products become more expensive?
(Essay)
4.8/5 (28)
An increase in the amount of human capital ________ the short-run aggregate supply curve and ________ the long-run aggregate supply curve.
(Multiple Choice)
4.9/5 (31)
In the short-run,real GDP can be greater than or less than potential GDP because in the short run the
(Multiple Choice)
4.8/5 (34)
9 Extended Problems
Price level Real GDP demanded (billions of 2005 dollars) Real GDP supplied (billions of 2005 dollars) 70 825 375 80 750 450 90 675 525 100 600 600 110 525 675 120 450 750 130 375 825 140 300 900
-The table above shows Purpleland's economy aggregate demand and supply schedules.Purpleland's potential GDP is $675 billion.
a) Plot the aggregate demand curve,the short-run aggregate supply curve,and the long-run aggregate supply curve.
b) What are the short-run equilibrium real GDP and price level in Purpleland?
c) What is the long-run equilibrium real GDP?
d) Is Purpleland's short-run macroeconomic equilibrium a full-employment equilibrium,below full-employment equilibrium,or above full-employment equilibrium?
What is the recessionary gap (if any)?
What is the inflationary gap (if any)?
e) Suppose aggregate demand increases by $150 billion.Plot the new aggregate demand curve.How do real GDP and the price level change in the short run?
f) Is Purpleland's new short-run macroeconomic equilibrium a full-employment equilibrium,below full-employment equilibrium,or above full-employment equilibrium?
What is the recessionary gap (if any)?
What is the inflationary gap (if any)?
(Essay)
5.0/5 (37)
Assume the economy is at long run equilibrium and oil prices rise.As a result,the ________ shifts ________.
(Multiple Choice)
4.8/5 (33)
What is the difference between the long-run aggregate supply and the short-run aggregate supply curves?
(Essay)
4.9/5 (34)
Which of the following changes does NOT shift the long-run aggregate supply curve?
(Multiple Choice)
4.9/5 (38)
Suppose the price level,the money wage,and the price of all other resources rise by 10 percent.This set of changes leads to
(Multiple Choice)
4.8/5 (41)
Other things constant,the economy's aggregate demand curve shows that
(Multiple Choice)
4.8/5 (43)
Filters
- Essay(0)
- Multiple Choice(0)
- Short Answer(0)
- True False(0)
- Matching(0)