Exam 14: Aggregate Demand and Supply
Exam 1: Introducing the Economic Way of Thinking177 Questions
Exam 1: A: Appendix: Applying Graphs to Economics69 Questions
Exam 2: Production Possibilities,Opportunity Cost,and Economic Growth200 Questions
Exam 3: Part 1: Market Demand and Supply250 Questions
Exam 3: Part 2: Market Demand and Supply106 Questions
Exam 4: Markets in Action250 Questions
Exam 5: Price Elasticity of Demand177 Questions
Exam 6: Production Costs249 Questions
Exam 7: Perfect Competition222 Questions
Exam 8: Monopoly170 Questions
Exam 9: Monopolistic Competition and Oligopoly161 Questions
Exam 10: Labor Markets and Income Distribution180 Questions
Exam 11: Gross Domestic Product202 Questions
Exam 12: Business Cycles and Unemployment194 Questions
Exam 13: Inflation127 Questions
Exam 14: Aggregate Demand and Supply188 Questions
Exam 14: A: Appendix: The Self-Correcting Aggregate Demand and Supply Model83 Questions
Exam 15: Fiscal Policy201 Questions
Exam 16: The Public Sector127 Questions
Exam 17: Federal Deficits,Surpluses,and the National Debt97 Questions
Exam 18: Money and the Federal Reserve System154 Questions
Exam 19: Money Creation246 Questions
Exam 20: Monetary Policy214 Questions
Exam 20: A: Appendix: Policy Disputes Using the Self-Correcting Aggregate Demand and Supply Model31 Questions
Exam 21: International Trade and Finance246 Questions
Exam 22: Economies in Transition104 Questions
Exam 23: Growth and the Less-Developed Countries116 Questions
Select questions type
In the United States during the 1960s,government spending dramatically increased to fight the Vietnam War,which resulted in:
(Multiple Choice)
4.7/5  (40)
(40)
Which of the following is not a component of the aggregate demand curve?
(Multiple Choice)
4.7/5 (35)
Which of the following could be expected to shift the aggregate demand curve?
(Multiple Choice)
4.9/5 (44)
Which of the following correctly describes the aggregate supply curve?
(Multiple Choice)
4.8/5 (33)
If a new method for obtaining oil from dry oil fields is found,then we will see:
(Multiple Choice)
4.7/5 (36)
When the economy is operating well below capacity,an increase in spending tends to be reflected primarily in a(n):
(Multiple Choice)
4.8/5 (33)
Which of the following could not be expected to shift the aggregate demand curve?
(Multiple Choice)
4.8/5 (34)
Other factors held constant,a decrease in resource prices will shift the aggregate:
(Multiple Choice)
4.9/5 (34)
Along the Keynesian range of the aggregate supply curve,higher aggregate demand fails to stimulate output and only causes inflation.
(True/False)
4.9/5 (34)
Exhibit 14-7 Aggregate supply and demand curves
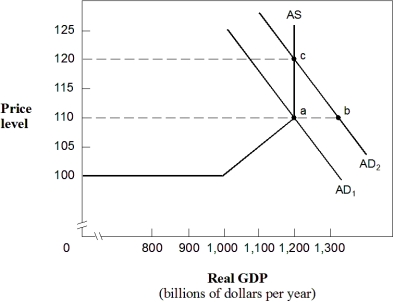 -In Exhibit 14-7,if aggregate demand increases from AD₁ to AD₂,
(Multiple Choice)
4.9/5 (36)
Suppose the economy is on the intermediate range of the aggregate supply curve.Which of the following would reduce both real GDP and the price level?
(Multiple Choice)
4.8/5 (34)
Exhibit 14-8 Aggregate demand and supply
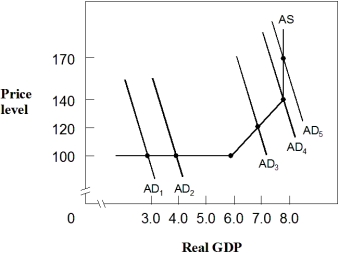 -In Exhibit 14-8,if aggregate demand shifts from AD₃ to AD₂,real GDP will:
(Multiple Choice)
4.7/5 (36)
An increase in input prices will cause the aggregate supply curve to shift rightward.
(True/False)
4.8/5 (35)
Exhibit 14-3 Aggregate supply and demand curves
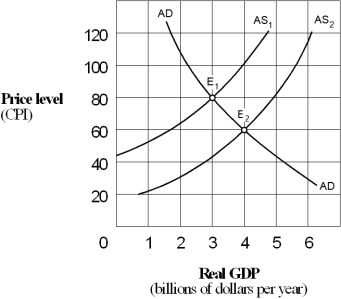 -A shift in the aggregate supply curve in Exhibit 14-3 from AS₁ to AS₂ would be caused by a(n):
(Multiple Choice)
4.7/5 (37)
Exhibit 14-4 Aggregate supply and demand curves
 -The increase in the price level as the economy moves from E₁ to E₂ in Exhibit 14-4 represents:
(Multiple Choice)
4.8/5 (27)
The aggregate supply curve shows the relationship between the price level and the level of real GDP produced by the nation's economy.
(True/False)
4.8/5 (43)
Along the intermediate range of the aggregate supply curve,an increase in the aggregate demand curve will increase:
(Multiple Choice)
4.8/5 (35)
Filters
- Essay(0)
- Multiple Choice(0)
- Short Answer(0)
- True False(0)
- Matching(0)