Exam 14: Data Mining
Exam 1: Introduction to Modeling30 Questions
Exam 2: Introduction to Spreadsheet Modeling30 Questions
Exam 3: Introduction to Optimization Modeling30 Questions
Exam 4: Linear Programming Models31 Questions
Exam 5: Network Models30 Questions
Exam 6: Optimization Models With Integer Variables30 Questions
Exam 7: Nonlinear Optimization Models30 Questions
Exam 8: Evolutionary Solver: An Alternative Optimization Procedure30 Questions
Exam 9: Decision Making Under Uncertainty30 Questions
Exam 10: Introduction to Simulation Modeling30 Questions
Exam 11: Simulation Models30 Questions
Exam 12: Queueing Models30 Questions
Exam 13: Regression and Forecasting Models30 Questions
Exam 14: Data Mining30 Questions
Select questions type
The primary advantage of neural networks is that they provide more accurate predictions,especially when the relationships are linear.
Free
(True/False)
4.9/5  (34)
(34)
Correct Answer: Verified
False
The K-Means clustering algorithm :
Free
(Multiple Choice)
4.8/5 (31)
Correct Answer:Verified
A
Today's organizations rely on their quantitative experts,who have access to large amounts of data,to make sense of it in a timely manner.
Free
(True/False)
4.8/5 (46)
Correct Answer:Verified
False
The last step of cluster analysis is to understand the shared characteristics of the observations in each cluster.
(True/False)
4.8/5 (26)
Exhibit 14.1
The age, weight, gender, and the number of children were tracked for 50 people who either have or have not been diagnosed with a certain illness. The data are provided in the table below.
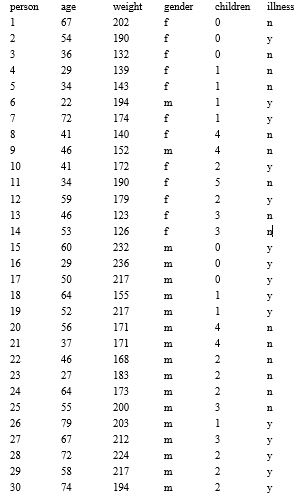 31 43 177 4 32 42 178 1 33 28 183 1 34 60 177 1 35 60 176 5 36 62 199 0 37 57 177 0 38 31 152 3 39 68 185 2 40 26 134 2 41 38 142 2 42 51 199 2 43 62 133 4 44 38 131 4 45 73 196 1 46 48 120 2 47 54 197 1 48 38 136 0 49 54 183 0 50 52 199 0
-See Exhibit 14-1 Use neural nets via Palisade's NeuralTools to classify the people as being diagnosed as having an illness or not. (Reserve 20% of the observations for testing.) How well does this method correctly classify people
31 43 177 4 32 42 178 1 33 28 183 1 34 60 177 1 35 60 176 5 36 62 199 0 37 57 177 0 38 31 152 3 39 68 185 2 40 26 134 2 41 38 142 2 42 51 199 2 43 62 133 4 44 38 131 4 45 73 196 1 46 48 120 2 47 54 197 1 48 38 136 0 49 54 183 0 50 52 199 0
-See Exhibit 14-1 Use neural nets via Palisade's NeuralTools to classify the people as being diagnosed as having an illness or not. (Reserve 20% of the observations for testing.) How well does this method correctly classify people
(Essay)
4.9/5 (41)
Exhibit 14.1
The age, weight, gender, and the number of children were tracked for 50 people who either have or have not been diagnosed with a certain illness. The data are provided in the table below.
31 43 177 4 32 42 178 1 33 28 183 1 34 60 177 1 35 60 176 5 36 62 199 0 37 57 177 0 38 31 152 3 39 68 185 2 40 26 134 2 41 38 142 2 42 51 199 2 43 62 133 4 44 38 131 4 45 73 196 1 46 48 120 2 47 54 197 1 48 38 136 0 49 54 183 0 50 52 199 0
-See Exhibit 14.1 - What kind of person is more likely to be diagnosed with the illness
(Essay)
4.9/5 (36)
Exhibit 14-3
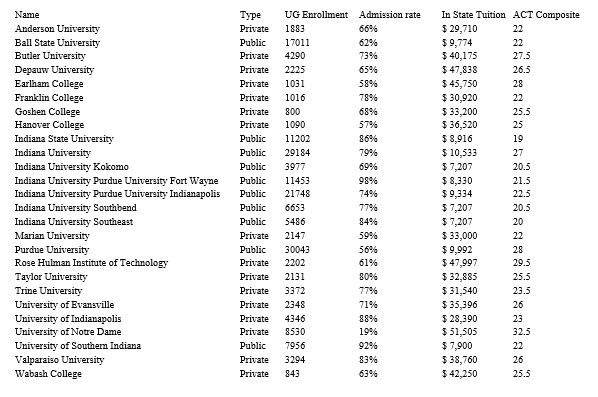
Information for 26 colleges and universities in the state of Indiana is provided in the table below. The following questions contain a sequence of steps for executing the K-Means Clustering Method.
 -Refer to Exhibit 14-3 Choose any three college indices from 1 to 26 as trial values for the cluster centers. Complete the logicto return the name of the college or university associated with the index as well as the standardized numeric measures.
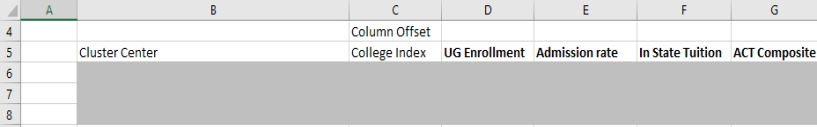
(Essay)
4.8/5 (31)
Which of the following is false concerning a data warehouse
(Multiple Choice)
4.8/5 (37)
Exhibit 14.1
The age, weight, gender, and the number of children were tracked for 50 people who either have or have not been diagnosed with a certain illness. The data are provided in the table below.
31 43 177 4 32 42 178 1 33 28 183 1 34 60 177 1 35 60 176 5 36 62 199 0 37 57 177 0 38 31 152 3 39 68 185 2 40 26 134 2 41 38 142 2 42 51 199 2 43 62 133 4 44 38 131 4 45 73 196 1 46 48 120 2 47 54 197 1 48 38 136 0 49 54 183 0 50 52 199 0
-See Exhibit 14.1 - How likely would a 40 year old,200 pound father of 2 children be to have the illness
(Essay)
4.8/5 (26)
Exhibit 14.2
The age, weight, gender, and the number of children were tracked for 25 people. It is not known if these people have or have not been diagnosed with a certain illness. The data are provided in the table below.
person age weight gender children illness 51 52 86 m 2 52 72 145 f 2 53 33 113 f 2 54 60 167 m 0 55 65 134 f 1 56 71 198 m 2 57 26 120 f 1 58 63 165 m 2 59 23 155 f 1 60 52 152 f 1 61 28 183 m 3 62 59 177 m 1 63 48 184 m 2 64 51 201 m 0 65 71 181 m 2 66 26 179 m 0 67 34 115 f 1 68 56 176 m 1 69 65 126 m 2 70 62 181 f 1 71 49 157 m 1 72 71 165 f 0 73 21 138 f 2 74 51 187 m 0 75 21 119 f 1
-See Exhibit 14-2 Using Palisade's NeuralTools and the results from the prior problem,use the prediction data in this table to classify these 25 people as having been diagnosed with an illness or not.
(Essay)
4.9/5 (39)
Exhibit 14.1
The age, weight, gender, and the number of children were tracked for 50 people who either have or have not been diagnosed with a certain illness. The data are provided in the table below.
31 43 177 4 32 42 178 1 33 28 183 1 34 60 177 1 35 60 176 5 36 62 199 0 37 57 177 0 38 31 152 3 39 68 185 2 40 26 134 2 41 38 142 2 42 51 199 2 43 62 133 4 44 38 131 4 45 73 196 1 46 48 120 2 47 54 197 1 48 38 136 0 49 54 183 0 50 52 199 0
-See Exhibit 14.1 - How well can logistic regression classify the people as having the illness or not
(Essay)
4.8/5 (33)
Better classification methods should improve lift,which is the increase in purchases gained through marketing to people with the highest probability of purchasing.
(True/False)
4.9/5 (38)
In data partitioning,data can be divided into training,testing,and prediction subsets.
(True/False)
4.9/5 (43)
Exhibit 14-3
Information for 26 colleges and universities in the state of Indiana is provided in the table below. The following questions contain a sequence of steps for executing the K-Means Clustering Method.
-Refer to exhibit 14-3 As a first step in grouping the Indiana colleges and universities into clusters,standardize the numeric measures.
(Essay)
4.9/5 (27)
In the classification method,when data are partitioned into the training and testing subsets:
(Multiple Choice)
4.8/5 (39)
Filters
- Essay(0)
- Multiple Choice(0)
- Short Answer(0)
- True False(0)
- Matching(0)