Exam 13: Regression and Forecasting Models
Exam 1: Introduction to Modeling30 Questions
Exam 2: Introduction to Spreadsheet Modeling30 Questions
Exam 3: Introduction to Optimization Modeling30 Questions
Exam 4: Linear Programming Models31 Questions
Exam 5: Network Models30 Questions
Exam 6: Optimization Models With Integer Variables30 Questions
Exam 7: Nonlinear Optimization Models30 Questions
Exam 8: Evolutionary Solver: An Alternative Optimization Procedure30 Questions
Exam 9: Decision Making Under Uncertainty30 Questions
Exam 10: Introduction to Simulation Modeling30 Questions
Exam 11: Simulation Models30 Questions
Exam 12: Queueing Models30 Questions
Exam 13: Regression and Forecasting Models30 Questions
Exam 14: Data Mining30 Questions
Select questions type
In regression analysis,we can often use the standard error of estimate se to judge which of several potential regression equations is the most useful.
Free
(True/False)
4.8/5  (33)
(33)
Correct Answer: Verified
True
The biggest challenge of regression is:
Free
(Multiple Choice)
4.8/5 (44)
Correct Answer:Verified
B
A time series can consist of four different components: trend,seasonal,cyclical,and random (or noise).
Free
(True/False)
4.7/5 (24)
Correct Answer:Verified
True
When using the moving average method,you must select ____ which represent(s)the number of terms in the moving average.
(Multiple Choice)
4.8/5 (35)
Exhibit 13-2
The station manager of a local television station is interested in predicting the amount of television (in hours) that people will watch in the viewing area. The explanatory variables are: X1 age (in years), X2 education (highest level obtained, in years) and X3 family size (number of family members in household). The multiple regression output is shown below:
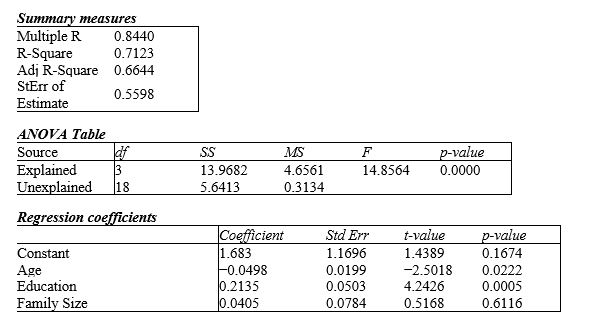 -Refer to Exhibit 13-2.Use the information above to estimate the linear regression model.
(Essay)
4.9/5 (41)
In multiple regression,the regression coefficients reflect the expected change in:
(Multiple Choice)
4.8/5 (33)
A model that uses temperature,season of the year (fall,winter,spring,summer),and whether or not it is a weekend,to predict the # of customers for the day would include how many independent variables
(Multiple Choice)
4.8/5 (38)
The percentage of variation explained R2 is the square of the correlation between the observed Y values and the fitted Y values.
(True/False)
4.8/5 (45)
Exhibit 13-2
The station manager of a local television station is interested in predicting the amount of television (in hours) that people will watch in the viewing area. The explanatory variables are: X1 age (in years), X2 education (highest level obtained, in years) and X3 family size (number of family members in household). The multiple regression output is shown below:
-Refer to Exhibit 13-2.Interpret each of the estimated regression coefficients of the regression model above.
(Essay)
4.7/5 (33)
In regression analysis,the variable we are trying to explain or predict is called the
(Multiple Choice)
4.8/5 (40)
Exhibit 13-3
The quarterly numbers of applications for home mortgage loans at a branch office of a large bank are recorded in the table below.
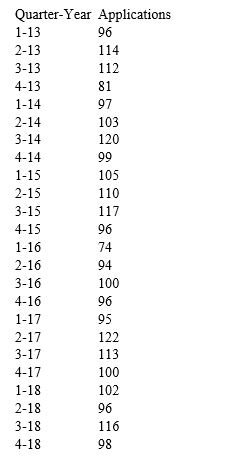 -Refer to Exhibit 13-3.Obtain a time series chart.Which of the forecasting models (one or more)do you think should be used for forecasting based on this chart
Why
-Refer to Exhibit 13-3.Obtain a time series chart.Which of the forecasting models (one or more)do you think should be used for forecasting based on this chart
Why
(Essay)
4.7/5 (26)
The residual is defined as the difference between the actual and predicted,or fitted values of the response variable.
(True/False)
4.9/5 (41)
The adjusted R2 is used primarily to monitor whether extra explanatory variables really belong in a multiple regression model.
(True/False)
4.8/5 (45)
A useful graph in almost any regression analysis is a scatterplot of residuals (on the vertical axis)versus fitted values (on the horizontal axis),where a "good" fit not only has small residuals,but it has residuals scattered randomly around zero with no apparent pattern.
(True/False)
5.0/5 (35)
Exhibit 13-2
The station manager of a local television station is interested in predicting the amount of television (in hours) that people will watch in the viewing area. The explanatory variables are: X1 age (in years), X2 education (highest level obtained, in years) and X3 family size (number of family members in household). The multiple regression output is shown below:
-Refer to Exhibit 13-2.Identify and interpret the percentage of variation explained (R2)for the model.
(Essay)
4.8/5 (24)
In reference to the equation ,the value 0.10 is the expected change in Y per unit change in X.
(True/False)
4.8/5 (30)
The smoothing constant used in simple exponential smoothing is analogous to the span in moving averages.
(True/False)
4.9/5 (38)
Filters
- Essay(0)
- Multiple Choice(0)
- Short Answer(0)
- True False(0)
- Matching(0)