Exam 6: Consumer Choice
Exam 1: Economics: The World Around You90 Questions
Exam 2: Choice, opportunity Costs, and Specialization95 Questions
Exam 3: Markets, Demand and Supply, and the Price System98 Questions
Exam 4: The Market System and the Private and Public Sector100 Questions
Exam 5: Elasticity: Demand and Supply132 Questions
Exam 6: Consumer Choice142 Questions
Exam 7: Supply: The Costs of Doing Business106 Questions
Exam 8: Profit Maximization122 Questions
Exam 9: Perfect Competition135 Questions
Exam 10: Monopoly118 Questions
Exam 11: Monopolistic Competition and Oligopoly114 Questions
Exam 12: Antitrust and Regulation100 Questions
Exam 13: Market Failures, Government Failures, and Rent Seeking121 Questions
Exam 14: Resource Markets112 Questions
Exam 15: The Labor Market117 Questions
Exam 16: Capital Markets100 Questions
Exam 17: The Land Market and Natural Resources55 Questions
Exam 18: Aging, Social Security and Health Care88 Questions
Exam 19: Income Distribution,Poverty and Government Policy115 Questions
Exam 20: World Trade Equilibrium112 Questions
Exam 21: International Trade Restrictions109 Questions
Exam 22: Exchange Rates and Financial Links Between Countries132 Questions
Select questions type
The term _____ refers to the idea that the value people place on money depends on where that money comes from.
(Multiple Choice)
4.7/5  (40)
(40)
The below indifference map shows the various combinations of hours of music and apples that yield different levels of utility. Figure 6.1 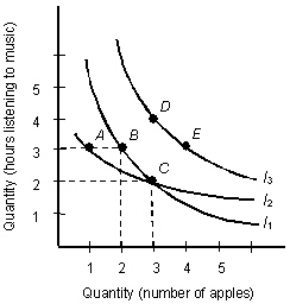 - According to Figure 6.1,which of the following is incorrect?
(Multiple Choice)
4.9/5 (33)
Suppose two out for coffee and donuts at the local donut store.The first donut you eat tastes incredibly good.The second one also tastes pretty good.The third donut seems just okay.With the fourth donut you are turning somewhat green.The fifth donut makes you sick.Your friend,an economist,describes your experience as the principle of:
(Multiple Choice)
4.8/5 (43)
The _____ effect indicates that an individual's income can buy more of all goods when the price of one good declines,everything else held constant.
(Multiple Choice)
4.9/5 (35)
The law of diminishing marginal utility states that as additional units are consumed,satisfaction per unit will decline.
(True/False)
4.8/5 (45)
The table below shows the total utility associated with various units of goods X and Y. Table 6.5
 - Refer to Table 6.5.Given that the price of good X is $2 per unit,the price of good Y is $5 per unit,and that the consumer spends a total of $14 on both goods,what is the total utility associated with the utility-maximizing combination?
(Multiple Choice)
4.9/5 (43)
It is often observed that,over the same period of time and for the same good,marginal utility declines rapidly for some consumers and very little for others.This observation illustrates:
(Multiple Choice)
4.8/5 (36)
The below figure shows the various combinations of the goods X and Y that yield different levels of utility. Figure 6.3 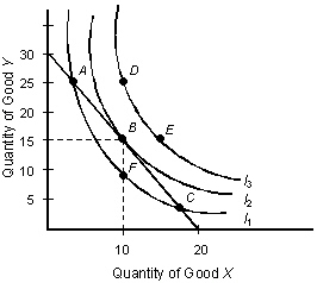 -In Figure 6.3,the consumer is in equilibrium at point:
(Multiple Choice)
4.8/5 (49)
The figure given below represents two indifference curves I1 and I2 of an individual. Figure 6.2 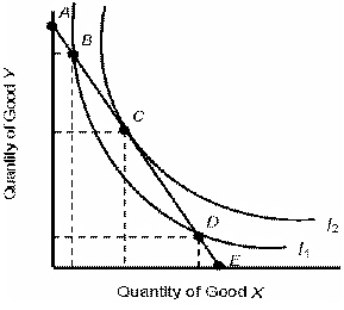 - Refer to Figure 6.2.Which of the following statements is true?
(Multiple Choice)
4.9/5 (37)
The below figure shows the various combinations of the goods X and Y that yield different levels of utility. Figure 6.3  - Refer to Figure 6.3.What combinations of X and Y are attainable by the consumer?
(Multiple Choice)
4.8/5 (40)
_____ is the lack of satisfaction yielded after consuming too much of the same product.
(Multiple Choice)
4.9/5 (37)
The prices that people are willing to pay for goods and services mostly depend on:
(Multiple Choice)
4.8/5 (36)
A utility-maximizing consumer always purchases a good that yields the greatest average utility per dollar of expenditure.
(True/False)
4.8/5 (38)
Utility is easy to measure in the real world with recent advances in psychometric technology.
(True/False)
4.8/5 (39)
The below table shows the average utility (in utils) obtained from the consumption of goods A andB. Table 6.3
 -Refer to Table 6.3.Which of the following statements is false?
(Multiple Choice)
4.9/5 (35)
The demand curve for a product can be derived from consumer equilibrium by:
(Multiple Choice)
4.8/5 (34)
Filters
- Essay(0)
- Multiple Choice(0)
- Short Answer(0)
- True False(0)
- Matching(0)