Exam 5: Elasticity and Its Application
Exam 1: Ten Principles of Economics347 Questions
Exam 2: Thinking Like an Economist535 Questions
Exam 3: Interdependence and the Gains From Trade442 Questions
Exam 4: The Market Forces of Supply and Demand569 Questions
Exam 5: Elasticity and Its Application503 Questions
Exam 6: Supply, Demand, and Government Policies556 Questions
Exam 7: Consumers, Producers, and the Efficiency of Markets460 Questions
Exam 8: Application: The Costs of Taxation422 Questions
Exam 9: Application: International Trade409 Questions
Exam 10: Measuring a Nations Income428 Questions
Exam 11: Measuring the Cost of Living436 Questions
Exam 12: Production and Growth417 Questions
Exam 13: Saving, Investment, and the Financial System473 Questions
Exam 14: The Basic Tools of Finance419 Questions
Exam 15: Unemployment571 Questions
Exam 16: The Monetary System423 Questions
Exam 17: Money Growth and Inflation388 Questions
Exam 18: Open-Economy Macroeconomic Models448 Questions
Exam 19: A Macroeconomic Theory of the Open Economy374 Questions
Exam 20: Aggregate Demand and Aggregate Supply471 Questions
Exam 21: The Influence of Monetary and Fiscal Policy on Aggregate Demand416 Questions
Exam 22: The Short-Run Trade-Off Between Inflation and Unemployment400 Questions
Exam 23: Six Debates Over Macroeconomic Policy235 Questions
Select questions type
OPEC successfully raised the world price of oil in the 1970s and early 1980s, primarily due to
(Multiple Choice)
4.8/5  (39)
(39)
Use the graph shown to answer the following questions. Put the correct letter(s) in the blank. 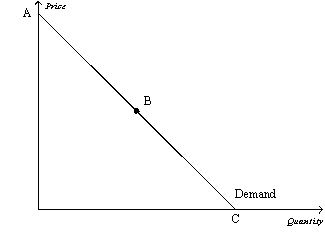 a. The elastic section of the graph is represented by section from _______.b. The inelastic section of the graph is represented by section from _______.c. The unit elastic section of the graph is represented by section _______.d. The portion of the graph in which a decrease in price would cause total revenue to fall would be from _________.e. The portion of the graph in which a decrease in price would cause total revenue to rise would be from _________.f. The portion of the graph in which a decrease in price would not cause a change in total revenue would be _________.g. The section of the graph in which total revenue would be at a maximum would be _______.h. The section of the graph in which elasticity is greater than 1 is _______.i. The section of the graph in which elasticity is equal to 1 is ______.j. The section of the graph in which elasticity is less than 1 is _______.
(Essay)
4.7/5 (38)
Which of the following statements is not valid when supply is perfectly elastic?
(Multiple Choice)
4.8/5 (38)
Which of the following is likely to have the most price inelastic demand?
(Multiple Choice)
4.8/5 (44)
Goods with close substitutes tend to have more elastic demands than do goods without close substitutes.
(True/False)
4.9/5 (29)
If the price elasticity of demand is 1.5, regardless of which two points on the demand curve are used to compute the elasticity, then demand is
(Multiple Choice)
4.8/5 (38)
Figure 5-2 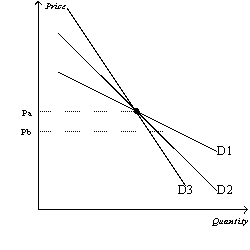 -Refer to Figure 5-2. As price falls from Pa to Pb, which demand curve represents the most elastic demand?
(Multiple Choice)
4.8/5 (36)
At price of $1.30 per pound, a local apple orchard is willing to supply 150 pounds of apples per day. At a price of $1.50 per pound, the orchard is willing to supply 170 pounds of apples per day. Using the midpoint method, the price elasticity of supply is about
(Multiple Choice)
4.9/5 (29)
When the price of bubble gum is $0.50, the quantity demanded is 400 packs per day. When the price falls to $0.40, the quantity demanded increases to 600. Given this information and using the midpoint method, we know that the demand for bubble gum is
(Multiple Choice)
4.8/5 (41)
Suppose that when the price of wheat is $2 per bushel, farmers can sell 10 million bushels. When the price of wheat is $3 per bushel, farmers can sell 8 million bushels. Which of the following statements is true? The demand for wheat is
(Multiple Choice)
4.8/5 (36)
A drug interdiction program that successfully reduces the supply of illegal drugs in the United States likely will
(Multiple Choice)
4.8/5 (38)
Table 5-5
 -Refer to Table 5-5. Which of the three supply curves represents the least elastic supply?
(Multiple Choice)
4.9/5 (38)
When studying how some event or policy affects a market, elasticity provides information on the
(Multiple Choice)
4.8/5 (25)
You are in charge of the local city-owned aquatic center. You need to increase the revenue generated by the aquatic center in order to meet expenses. The mayor advises you to decrease the price of a day pass. The city manager recommends increasing the price of a day pass. You realize that
(Multiple Choice)
4.9/5 (33)
Filters
- Essay(0)
- Multiple Choice(0)
- Short Answer(0)
- True False(0)
- Matching(0)