Exam 5: Elasticity and Its Application
Exam 1: Ten Principles of Economics347 Questions
Exam 2: Thinking Like an Economist535 Questions
Exam 3: Interdependence and the Gains From Trade442 Questions
Exam 4: The Market Forces of Supply and Demand569 Questions
Exam 5: Elasticity and Its Application503 Questions
Exam 6: Supply, Demand, and Government Policies556 Questions
Exam 7: Consumers, Producers, and the Efficiency of Markets460 Questions
Exam 8: Application: The Costs of Taxation422 Questions
Exam 9: Application: International Trade409 Questions
Exam 10: Measuring a Nations Income428 Questions
Exam 11: Measuring the Cost of Living436 Questions
Exam 12: Production and Growth417 Questions
Exam 13: Saving, Investment, and the Financial System473 Questions
Exam 14: The Basic Tools of Finance419 Questions
Exam 15: Unemployment571 Questions
Exam 16: The Monetary System423 Questions
Exam 17: Money Growth and Inflation388 Questions
Exam 18: Open-Economy Macroeconomic Models448 Questions
Exam 19: A Macroeconomic Theory of the Open Economy374 Questions
Exam 20: Aggregate Demand and Aggregate Supply471 Questions
Exam 21: The Influence of Monetary and Fiscal Policy on Aggregate Demand416 Questions
Exam 22: The Short-Run Trade-Off Between Inflation and Unemployment400 Questions
Exam 23: Six Debates Over Macroeconomic Policy235 Questions
Select questions type
Good news for farming can be bad news for farmers because the
(Multiple Choice)
4.7/5  (32)
(32)
An advantage of using the midpoint method to calculate the price elasticity of demand is that it uses the metric system.
(True/False)
4.9/5 (39)
Supply is said to be inelastic if the quantity supplied responds substantially to changes in the price and elastic if the quantity supplied responds only slightly to price.
(True/False)
4.9/5 (34)
The OPEC oil cartel has difficulty maintaining high prices in the long run because the supply of oil is more inelastic in the long run than in the short run.
(True/False)
4.7/5 (32)
Using the midpoint method, compute the elasticity of demand between points A and B. Is demand along this portion of the curve elastic or inelastic? Interpret your answer with regard to price and quantity demanded. Now compute the elasticity of demand between points B and C. Is demand along this portion of the curve elastic or inelastic? 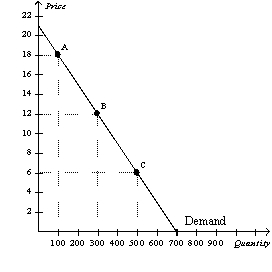
(Essay)
4.8/5 (34)
Suppose demand is perfectly inelastic, and the supply of the good in question decreases. As a result,
(Multiple Choice)
4.9/5 (28)
When we move upward and to the left along a linear, downward-sloping demand curve, price elasticity of demand
(Multiple Choice)
4.8/5 (31)
For a particular good, a 2 percent increase in price causes a 12 percent decrease in quantity demanded. Which of the following statements is most likely applicable to this good?
(Multiple Choice)
4.8/5 (43)
Figure 5-12 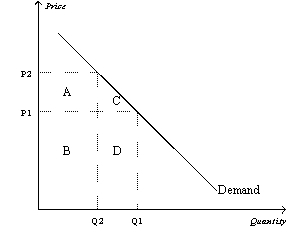 -Refer to Figure 5-12. Total revenue when the price is P1 is represented by the area(s)
(Multiple Choice)
4.9/5 (30)
Figure 5-4 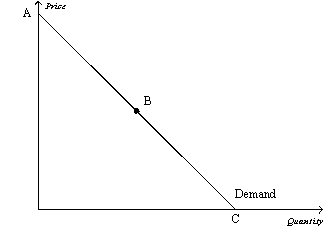 -Refer to Figure 5-4. The section of the demand curve at point B represents the
(Multiple Choice)
4.8/5 (33)
If we observe that when the price of chocolate increases by 10%, total revenue increases by 10%, then the demand for chocolate is unit price elastic.
(True/False)
5.0/5 (37)
Figure 5-18 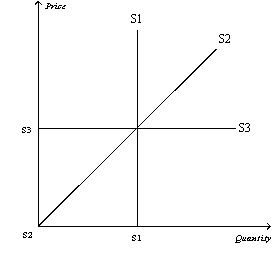 -Refer to Figure 5-18. Which supply curve represents perfectly inelastic supply?
(Multiple Choice)
4.9/5 (39)
Table 5-2
Priea Quintit \ 100 0 \ 80 10 \ 60 20 \ 40 30 \ 20 40 \ 0 50
-Refer to Table 5-2. Using the midpoint method, if the price falls from $40 to $20, the absolute value of the price elasticity of demand is
(Multiple Choice)
4.8/5 (38)
Assume that a 4 percent increase in income results in a 2 percent increase in the quantity demanded of a good. The income elasticity of demand for the good is
(Multiple Choice)
4.9/5 (31)
Figure 5-1 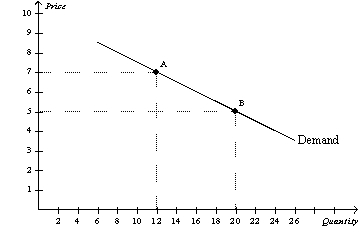 -Refer to Figure 5-1. Between point A and point B, the slope is equal to
(Multiple Choice)
4.8/5 (36)
Supply and demand both tend to be more elastic in the long run and more inelastic in the short run.
(True/False)
4.8/5 (37)
If a firm is facing inelastic demand, then the firm should decrease price to increase revenue.
(True/False)
4.8/5 (39)
Demand is said to have unit elasticity if the price elasticity of demand is
(Multiple Choice)
4.8/5 (33)
Filters
- Essay(0)
- Multiple Choice(0)
- Short Answer(0)
- True False(0)
- Matching(0)