Exam 5: Elasticity and Its Application
Exam 1: Ten Principles of Economics281 Questions
Exam 2: Thinking Like an Economist451 Questions
Exam 3: Interdependence and the Gains From Trade353 Questions
Exam 4: The Market Forces of Supply and Demand467 Questions
Exam 5: Elasticity and Its Application409 Questions
Exam 6: Supply, Demand, and Government Policies459 Questions
Exam 7: Consumers, Producers, and the Efficiency of Markets363 Questions
Exam 8: Application: The Costs of Taxation353 Questions
Exam 9: Application: International Trade333 Questions
Exam 10: Externalities352 Questions
Exam 11: Public Goods and Common Resources270 Questions
Exam 12: The Design of the Tax System397 Questions
Exam 13: The Costs of Production434 Questions
Exam 14: Firms in Competitive Markets381 Questions
Exam 15: Monopoly427 Questions
Exam 16: Monopolistic Competition416 Questions
Exam 17: Oligopoly325 Questions
Exam 18: The Markets for the Factors of Production361 Questions
Exam 19: Earnings and Discrimination335 Questions
Exam 20: Income Inequality and Poverty312 Questions
Exam 21: The Theory of Consumer Choice354 Questions
Exam 22: Frontiers of Microeconomics262 Questions
Exam 23: Measuring a Nations Income343 Questions
Exam 24: Measuring the Cost of Living358 Questions
Exam 25: Production and Growth335 Questions
Exam 26: Saving, investment, and the Financial System381 Questions
Exam 27: The Basic Tools of Finance336 Questions
Exam 28: Unemployment533 Questions
Exam 29: The Monetary System366 Questions
Exam 30: Money Growth and Inflation312 Questions
Exam 31: Open-Economy Macroeconomics: Basic Concepts346 Questions
Exam 32: A Macroeconomic Theory of the Open Economy300 Questions
Exam 33: Aggregate Demand and Aggregate Supply386 Questions
Exam 34: The Influence of Monetary and Fiscal Policy on Aggregate Demand334 Questions
Exam 35: The Short-Run Trade-Off Between Inflation and Unemployment306 Questions
Exam 36: Five Debates Over Macroeconomic Policy179 Questions
Select questions type
When demand is inelastic,a decrease in price increases total revenue.
(True/False)
4.9/5  (32)
(32)
If the price elasticity of demand for aluminum foil is 1.45,then a 2.4% decrease in the price of aluminum foil will increase the quantity demanded of aluminum foil by
(Multiple Choice)
4.9/5 (35)
If two supply curves pass through the same point and one is steep and the other is flat,which of the following statements is correct?
(Multiple Choice)
5.0/5 (38)
Which of the following statements does not help to explain why government drug interdiction increases drug-related crime?
(Multiple Choice)
4.8/5 (30)
Figure 5-3 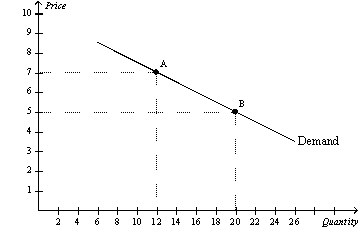 -Refer to Figure 5-3.Between point A and point B on the graph,demand is
(Multiple Choice)
5.0/5 (41)
Figure 5-4 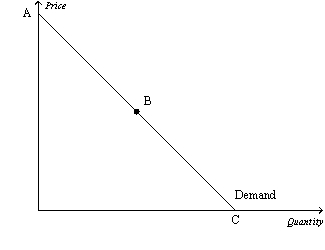 -Refer to Figure 5-4.The section of the demand curve from B to C represents the
(Multiple Choice)
4.7/5 (34)
The demand for bread is likely to be more elastic than the demand for solid-gold bread plates.
(True/False)
4.9/5 (35)
Which of the following statements about the price elasticity of demand is correct?
(Multiple Choice)
4.8/5 (39)
If the price elasticity of demand for a good is 0.4,then a 10 percent increase in price results in a
(Multiple Choice)
4.8/5 (28)
Figure 5-5 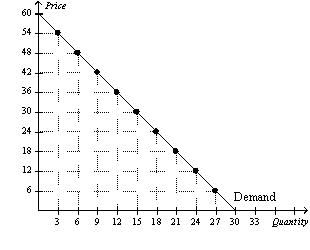 -Refer to Figure 5-5.At a price of $12 per unit,sellers' total revenue amounts to
(Multiple Choice)
4.8/5 (34)
To determine whether a good is considered normal or inferior,one could examine the value of the
(Multiple Choice)
4.8/5 (36)
Figure 5-4
-Refer to Figure 5-4.The section of the demand curve from A to B represents the
(Multiple Choice)
4.9/5 (31)
A key determinant of the price elasticity of supply is the time period under consideration.Which of the following statements best explains this fact?
(Multiple Choice)
4.7/5 (31)
The demand for soap is more elastic than the demand for Dove soap.
(True/False)
4.8/5 (40)
The cross-price elasticity of garlic salt and onion salt is -2,which indicates that garlic salt and onion salt are substitutes.
(True/False)
4.7/5 (32)
Cross-price elasticity is used to determine whether goods are substitutes or complements.
(True/False)
4.8/5 (31)
Figure 5-13 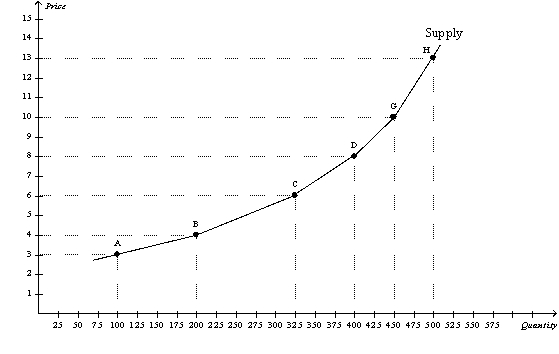 -Refer to Figure 5-13.Using the midpoint method,what is the price elasticity of supply between points D and G?
(Multiple Choice)
4.8/5 (27)
Table 5-6
 -Refer to Table 5-6.Which of the three supply curves represents the least elastic supply?
(Multiple Choice)
4.7/5 (43)
When the price of a good is $5,the quantity demanded is 120 units per month;when the price is $7,the quantity demanded is 100 units per month.Using the midpoint method,the price elasticity of demand is about
(Multiple Choice)
4.7/5 (29)
Filters
- Essay(0)
- Multiple Choice(0)
- Short Answer(0)
- True False(0)
- Matching(0)