Exam 5: Elasticity and Its Application
Exam 1: Ten Principles of Economics281 Questions
Exam 2: Thinking Like an Economist451 Questions
Exam 3: Interdependence and the Gains From Trade353 Questions
Exam 4: The Market Forces of Supply and Demand467 Questions
Exam 5: Elasticity and Its Application409 Questions
Exam 6: Supply, Demand, and Government Policies459 Questions
Exam 7: Consumers, Producers, and the Efficiency of Markets363 Questions
Exam 8: Application: The Costs of Taxation353 Questions
Exam 9: Application: International Trade333 Questions
Exam 10: Externalities352 Questions
Exam 11: Public Goods and Common Resources270 Questions
Exam 12: The Design of the Tax System397 Questions
Exam 13: The Costs of Production434 Questions
Exam 14: Firms in Competitive Markets381 Questions
Exam 15: Monopoly427 Questions
Exam 16: Monopolistic Competition416 Questions
Exam 17: Oligopoly325 Questions
Exam 18: The Markets for the Factors of Production361 Questions
Exam 19: Earnings and Discrimination335 Questions
Exam 20: Income Inequality and Poverty312 Questions
Exam 21: The Theory of Consumer Choice354 Questions
Exam 22: Frontiers of Microeconomics262 Questions
Exam 23: Measuring a Nations Income343 Questions
Exam 24: Measuring the Cost of Living358 Questions
Exam 25: Production and Growth335 Questions
Exam 26: Saving, investment, and the Financial System381 Questions
Exam 27: The Basic Tools of Finance336 Questions
Exam 28: Unemployment533 Questions
Exam 29: The Monetary System366 Questions
Exam 30: Money Growth and Inflation312 Questions
Exam 31: Open-Economy Macroeconomics: Basic Concepts346 Questions
Exam 32: A Macroeconomic Theory of the Open Economy300 Questions
Exam 33: Aggregate Demand and Aggregate Supply386 Questions
Exam 34: The Influence of Monetary and Fiscal Policy on Aggregate Demand334 Questions
Exam 35: The Short-Run Trade-Off Between Inflation and Unemployment306 Questions
Exam 36: Five Debates Over Macroeconomic Policy179 Questions
Select questions type
If the price of natural gas rises,when is the price elasticity of demand likely to be the highest?
(Multiple Choice)
4.8/5  (34)
(34)
Figure 5-13 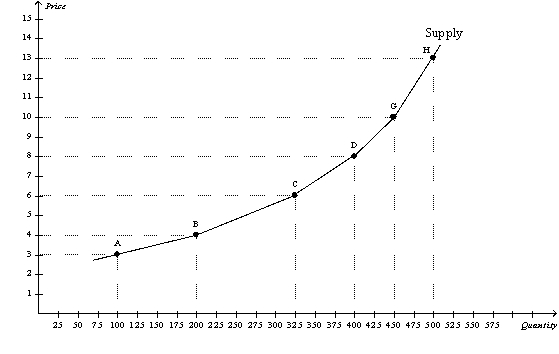 -Refer to Figure 5-13.Along which of these segments of the supply curve is supply most elastic?
(Multiple Choice)
4.9/5 (36)
Your younger sister needs $50 to buy a new bike.She has opened a lemonade stand to make the money she needs.Your mother is paying for all of the ingredients.She currently is charging 25 cents per cup,but she wants to adjust her price to earn the $50 faster.If you know that the demand for lemonade is elastic,what is your advice to her?
(Multiple Choice)
4.8/5 (28)
Figure 5-4 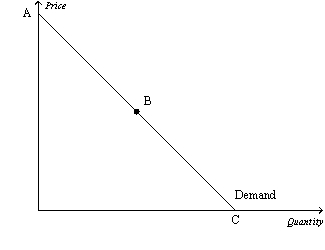 -Refer to Figure 5-4.Assume the section of the demand curve from A to B corresponds to prices between $6 and $12.Then,when the price increases from $8 to $10,
(Multiple Choice)
4.8/5 (27)
The income elasticity of demand is defined as the percentage change in quantity demanded divided by the percentage change in price.
(True/False)
4.9/5 (32)
Figure 5-3 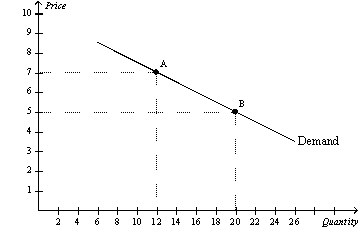 -The midpoint method for calculating elasticities is convenient in that it allows us to
(Multiple Choice)
5.0/5 (30)
Suppose a producer is able to separate customers into two groups,one having an inelastic demand and the other having an elastic demand.If the producer's objective is to increase total revenue,she should
(Multiple Choice)
4.8/5 (38)
Figure 5-5 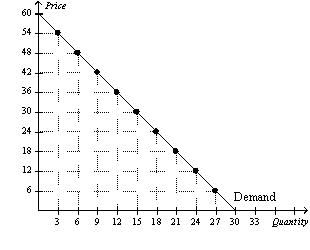 -Refer to Figure 5-5.At a price of $48 per unit,sellers' total revenue amounts to
(Multiple Choice)
4.9/5 (42)
Along the elastic portion of a linear demand curve,total revenue rises as price rises.
(True/False)
4.9/5 (34)
Alice says that she would buy one banana split a day regardless of the price.If she is telling the truth,
(Multiple Choice)
4.9/5 (38)
In January the price of widgets was $1.00,and Wendy's Widgets produced 80 widgets.In February the price of widgets was $1.50,and Wendy's Widgets produced 110 widgets.In March the price of widgets was $2.00,and Wendy's Widgets produced 140 widgets.The price elasticity of supply of Wendy's Widgets was
(Multiple Choice)
4.7/5 (34)
If the price elasticity of supply for a good is equal to infinity,then
(Multiple Choice)
4.9/5 (40)
The midpoint method is used to calculate elasticity between two points because it gives the same answer regardless of the direction of the change.
(True/False)
4.7/5 (34)
When we move upward and to the left along a linear,downward-sloping demand curve,price elasticity of demand
(Multiple Choice)
4.9/5 (38)
Harry's Barber Shop increased its total monthly revenue from $1,500 to $1,800 when it raised the price of a haircut from $5 to $9.The price elasticity of demand for Harry's Haircuts is
(Multiple Choice)
4.8/5 (39)
Figure 5-4
-Refer to Figure 5-4.The section of the demand curve from B to C represents the
(Multiple Choice)
5.0/5 (28)
Holding all other forces constant,if decreasing the price of a good leads to a decrease in total revenue,then the demand for the good must be
(Multiple Choice)
4.9/5 (32)
If the quantity demanded of a certain good responds only slightly to a change in the price of the good,then
(Multiple Choice)
4.8/5 (36)
When the price of bubble gum is $0.50,the quantity demanded is 400 packs per day.When the price falls to $0.40,the quantity demanded increases to 600.Given this information and using the midpoint method,we know that the demand for bubble gum is
(Multiple Choice)
4.8/5 (29)
Figure 5-4
-Refer to Figure 5-4.If the price decreases in the region of the demand curve between points B and C,we can expect total revenue to
(Multiple Choice)
4.8/5 (48)
Filters
- Essay(0)
- Multiple Choice(0)
- Short Answer(0)
- True False(0)
- Matching(0)