Exam 5: Elasticity and Its Application
Exam 1: Ten Principles of Economics281 Questions
Exam 2: Thinking Like an Economist451 Questions
Exam 3: Interdependence and the Gains From Trade353 Questions
Exam 4: The Market Forces of Supply and Demand467 Questions
Exam 5: Elasticity and Its Application409 Questions
Exam 6: Supply, Demand, and Government Policies459 Questions
Exam 7: Consumers, Producers, and the Efficiency of Markets363 Questions
Exam 8: Application: The Costs of Taxation353 Questions
Exam 9: Application: International Trade333 Questions
Exam 10: Externalities352 Questions
Exam 11: Public Goods and Common Resources270 Questions
Exam 12: The Design of the Tax System397 Questions
Exam 13: The Costs of Production434 Questions
Exam 14: Firms in Competitive Markets381 Questions
Exam 15: Monopoly427 Questions
Exam 16: Monopolistic Competition416 Questions
Exam 17: Oligopoly325 Questions
Exam 18: The Markets for the Factors of Production361 Questions
Exam 19: Earnings and Discrimination335 Questions
Exam 20: Income Inequality and Poverty312 Questions
Exam 21: The Theory of Consumer Choice354 Questions
Exam 22: Frontiers of Microeconomics262 Questions
Exam 23: Measuring a Nations Income343 Questions
Exam 24: Measuring the Cost of Living358 Questions
Exam 25: Production and Growth335 Questions
Exam 26: Saving, investment, and the Financial System381 Questions
Exam 27: The Basic Tools of Finance336 Questions
Exam 28: Unemployment533 Questions
Exam 29: The Monetary System366 Questions
Exam 30: Money Growth and Inflation312 Questions
Exam 31: Open-Economy Macroeconomics: Basic Concepts346 Questions
Exam 32: A Macroeconomic Theory of the Open Economy300 Questions
Exam 33: Aggregate Demand and Aggregate Supply386 Questions
Exam 34: The Influence of Monetary and Fiscal Policy on Aggregate Demand334 Questions
Exam 35: The Short-Run Trade-Off Between Inflation and Unemployment306 Questions
Exam 36: Five Debates Over Macroeconomic Policy179 Questions
Select questions type
Figure 5-14 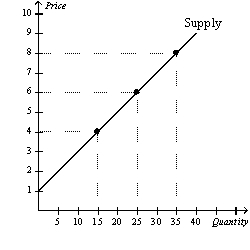 -Refer to Figure 5-14.Using the midpoint method,what is the price elasticity of supply between $4 and $6?
(Multiple Choice)
4.7/5  (36)
(36)
At a price of $1.00,a local coffee shop is willing to supply 100 cinnamon rolls per day.At a price of $1.20,the coffee shop would be willing to supply 150 cinnamon rolls per day.Using the midpoint method,the price elasticity of supply is
(Multiple Choice)
4.9/5 (31)
Figure 5-4 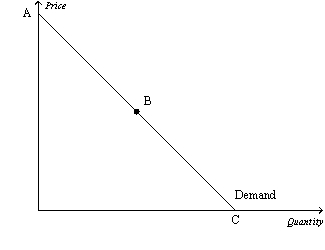 -Refer to Figure 5-4.If the price increases in the region of the demand curve between points A and B,we can expect total revenue to
(Multiple Choice)
4.9/5 (41)
If the price elasticity of supply for wheat is less than 1,then the supply of wheat is
(Multiple Choice)
4.9/5 (35)
Which of the following could be the price elasticity of demand for a good for which an increase in price would increase revenue?
(Multiple Choice)
5.0/5 (26)
Scenario 5-4
Suppose the government is concerned about firms in the United States importing illegal caviar.As a result,the government increases border patrols to catch illegal shipments.U.S.Customs agents perform DNA testing on the caviar to determine if it comes from endangered species of fish.If so,the government destroys the caviar.
-Refer to Scenario 5-4.What would we expect to observe in the caviar market?
(Multiple Choice)
4.9/5 (36)
Figure 5-5 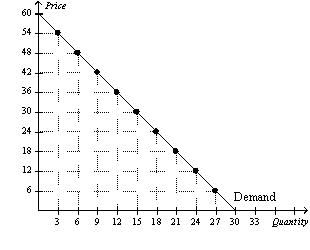 -Refer to Figure 5-5.The maximum value of total revenue corresponds to a price of
(Multiple Choice)
4.9/5 (43)
Figure 5-11 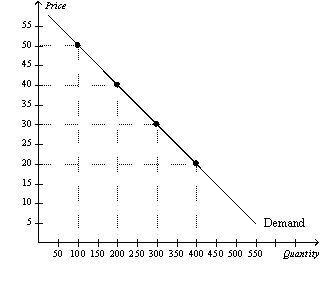 -Refer to Figure 5-11.When the price is $30,total revenue is
(Multiple Choice)
5.0/5 (40)
Figure 5-7
The following graph shows the linear demand curve for a particular good. 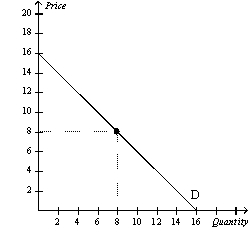 -Refer to Figure 5-7.For prices below $6,demand is price
(Multiple Choice)
4.7/5 (29)
If the price elasticity of supply is 1.5,and a price increase led to a 1.8% increase in quantity supplied,then the price increase amounted to
(Multiple Choice)
4.8/5 (35)
Which of the following should be held constant when calculating an income elasticity of demand?
(Multiple Choice)
4.8/5 (40)
Which of the following would be true as the price elasticity of supply approaches infinity?
(Multiple Choice)
4.9/5 (40)
Using the midpoint method,the price elasticity of demand for a good is computed to be approximately 2.Which of the following events is consistent with a 0.1 percent increase in the price of the good?
(Multiple Choice)
4.9/5 (29)
According to a New York Times article published in November 2005,author Anna Bernasek asserts that a 10 percent increase in the price of gasoline leads to a decline in the quantity demanded of about
(Multiple Choice)
4.8/5 (41)
If the price elasticity of demand for tuna is 0.7,then a 1.5% increase in the price of tuna will decrease the quantity demanded of tuna by
(Multiple Choice)
4.9/5 (29)
Filters
- Essay(0)
- Multiple Choice(0)
- Short Answer(0)
- True False(0)
- Matching(0)