Exam 10: Monopolistic Competition: The Competitive Model in a More Realistic
Exam 1: Economics: Foundations and Models159 Questions
Exam 2: Choices and Trade-Offs in the Market192 Questions
Exam 3: Where Prices Come From: The Interaction of Demand and Supply202 Questions
Exam 4: Elasticity: The Responsiveness of Demand and Supply224 Questions
Exam 5: Economic Efficiency, Government Price Setting and Taxes187 Questions
Exam 6: Consumer Choice and Behavioural Economics254 Questions
Exam 7: Technology Production and Costs301 Questions
Exam 8: Firms in Perfectly Competitive Markets269 Questions
Exam 9: Monopoly Markets281 Questions
Exam 10: Monopolistic Competition: The Competitive Model in a More Realistic255 Questions
Exam 11: Oligopoly: Markets With Few Competitors186 Questions
Exam 12: The Markets for Labour and Other Factors of Production250 Questions
Exam 13: Comparative Advantage and the Gains From International Trade131 Questions
Exam 14: Government Intervention in the Market113 Questions
Exam 15: Externalities, Environmental Policy and Public Goods212 Questions
Exam 16: The Distribution of Income and Social Policy121 Questions
Select questions type
Figure 10.6 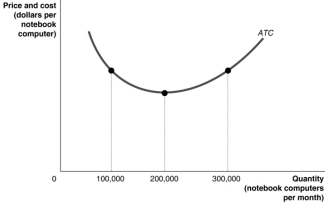 -Refer to Figure 10.6.Suppose Dell finds the relationship between the average total cost of producing notebook computers and the quantity of notebook computers produced is as shown by Figure 10-6.Dell will maximise profits if it produces ________ notebook computers per month.
(Multiple Choice)
4.8/5  (36)
(36)
Figure 10.8 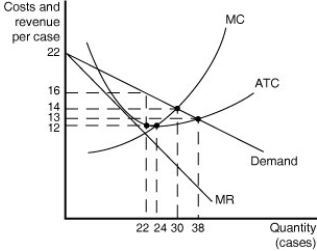 Figure 10.8 shows cost and demand curves for a monopolistically competitive producer of iced tea.
-Refer to Figure 10.8.Based on the diagram, one can conclude that
Figure 10.8 shows cost and demand curves for a monopolistically competitive producer of iced tea.
-Refer to Figure 10.8.Based on the diagram, one can conclude that
(Multiple Choice)
4.7/5 (43)
Long-run equilibrium under monopolistic competition is similar to that under perfect competition in that
(Multiple Choice)
4.8/5 (29)
Table 10.1 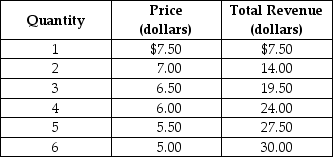 -Refer to Table 10.1.What portion of the marginal revenue of the 5th unit is due to the output effect and what portion is due to the price effect?
(Multiple Choice)
4.7/5 (31)
Figure 10.4 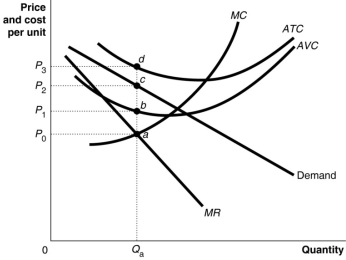 Figure 10.4 shows short-run cost and demand curves for a monopolistically competitive firm in the market for designer watches.
-Refer to Figure 10.4.The area that represents the loss made by the firm is
Figure 10.4 shows short-run cost and demand curves for a monopolistically competitive firm in the market for designer watches.
-Refer to Figure 10.4.The area that represents the loss made by the firm is
(Multiple Choice)
4.7/5 (34)
What is the difference between zero accounting profit and zero economic profit?
__________________________________________________________________________________________________________________________________________________________________________________________
(Essay)
4.9/5 (38)
For a downward-sloping demand curve, marginal revenue decreases as quantity sold increases.
(True/False)
4.8/5 (39)
Suppose that if a local McDonald's restaurant reduces the price of a Big Mac from $4.00 to $3.25, the number of Big Macs it sells per day will increase from 4 to 5.Explain the output effect and the price effect resulting from this change.Using a graph, illustrate both the loss in revenue from selling each of the first 4 Big Macs for $0.75 less and the additional revenue from selling 1 more Big Mac.What is the total change in revenue received which results from this price decrease?
__________________________________________________________________________________________________________________________________________________________________________________________
(Essay)
4.7/5 (35)
Table 10.1
-Refer to Table 10.1.What portion of the marginal revenue of the 4th unit is due to the output effect and what portion is due to the price effect?
(Multiple Choice)
4.8/5 (39)
Figure 10.17 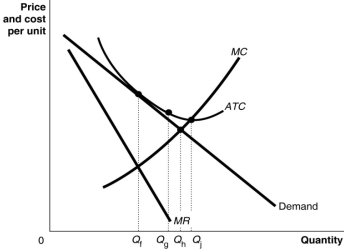 -Refer to Figure 10.17.The allocatively efficient output for the firm represented in the diagram is
(Multiple Choice)
4.9/5 (36)
A firm that is first to the market with a new product frequently discovers that there are design flaws or problems with the product that were not anticipated.How do these problems affect the innovating firm?
(Multiple Choice)
4.8/5 (36)
In the short run, a profit-maximising firm's decision to produce should be guided by whether
(Multiple Choice)
4.8/5 (37)
Table 10.3 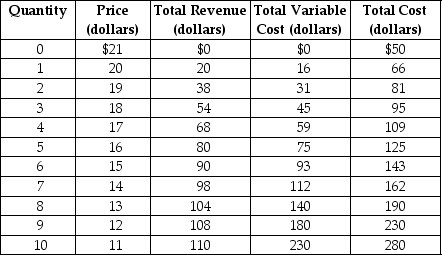 Table 10.3 shows the demand and cost schedules for a monopolistically competitive firm.
-Refer to Table 10.3.The average variable cost of production at its optimal output level is
Table 10.3 shows the demand and cost schedules for a monopolistically competitive firm.
-Refer to Table 10.3.The average variable cost of production at its optimal output level is
(Multiple Choice)
4.9/5 (35)
When a monopolistically competitive firm cuts its price to increase its sales, it experiences a loss in revenue due to the
(Multiple Choice)
4.7/5 (41)
Figure 10.9 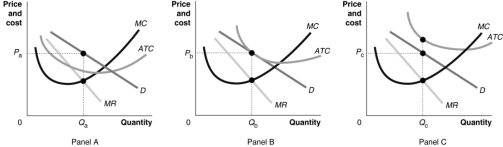 -Refer to Figure 10.9.Which of the graphs in the figure depicts a monopolistically competitive firm that is earning economic profits?
(Multiple Choice)
4.8/5 (35)
Only one of the following statements is correct.The statements compare perfectly competitive (PC)markets and monopolistically competitive (MC)markets.Which statement is correct?
(Multiple Choice)
4.8/5 (42)
In the long-run equilibrium, a monopolistically competitive firm earning normal profit produces the allocatively efficient output level.
(True/False)
5.0/5 (37)
Which of the following can a firm use to defend a successful product's brand name?
(Multiple Choice)
4.8/5 (33)
Compared to a perfectly competitive firm, the demand curve facing a monopolistically competitive firm is
(Multiple Choice)
4.9/5 (37)
Filters
- Essay(0)
- Multiple Choice(0)
- Short Answer(0)
- True False(0)
- Matching(0)