Exam 5: Constraints, Choices, and Demand
Exam 1: Introduction58 Questions
Exam 2: Supply and Demand77 Questions
Exam 3: Balancing Benefits and Costs70 Questions
Exam 4: Consumer Preferences71 Questions
Exam 5: Constraints, Choices, and Demand74 Questions
Exam 6: Demand and Welfare74 Questions
Exam 7: Technology and Production72 Questions
Exam 8: Cost72 Questions
Exam 9: Profit Maximization72 Questions
Exam 10: Choices Involving Time72 Questions
Exam 11: Choices Involving Risk58 Questions
Exam 12: Choices Involving Strategy62 Questions
Exam 13: Behavioral Economics57 Questions
Exam 14: Equilibrium and Efficiency57 Questions
Exam 15: Market Intervention58 Questions
Exam 16: General Equilibrium, Efficiency, and Equity57 Questions
Exam 17: Monopoly62 Questions
Exam 18: Pricing Policies57 Questions
Exam 19: Oligopoly62 Questions
Exam 20: Externalities and Public Goods62 Questions
Exam 21: Asymmetric Information65 Questions
Select questions type
Which of the following is NOT given in the text as a problem with using surveys to determine consumer preferences?
(Multiple Choice)
4.9/5  (33)
(33)
Refer to Figure 5.5.Which diagram shows the price-consumption curve resulting from a decrease in the price of good X? 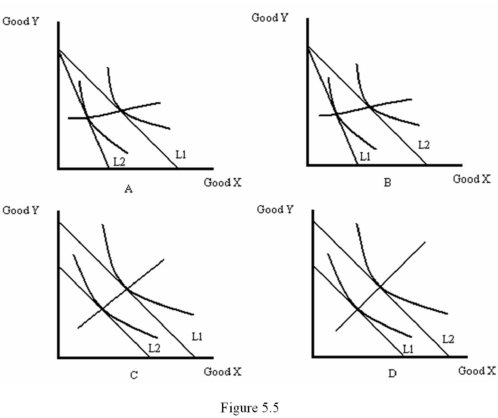
(Multiple Choice)
4.8/5 (40)
Refer to Figure 5.6.Which diagram shows a decrease in income with bread being normal and soup being inferior? 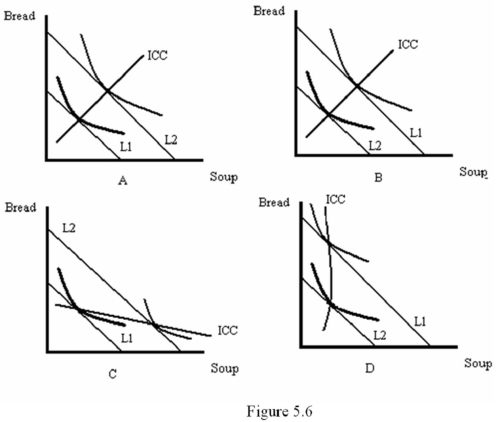
(Multiple Choice)
4.8/5 (30)
Suppose a consumer buys pizza (P)and soft drinks (S).The price of pizza is $10,the price of soft drinks is $2 and the consumer's income is $100.If pizza is measured on the vertical axis and soft drinks are measured on the horizontal axis,then the consumer's budget constraint is given by:
(Multiple Choice)
4.7/5 (37)
Refer to Table 5.1,which shows Madeline's preference ranking for various consumption bundles of bread and soup,where 1 represents her first choice,2 her second,and so on.If the price of soup is $3 per bowl,the price of bread is $3 per loaf and Madeline's income is $9 per day,which combination of bread and soup will she choose? 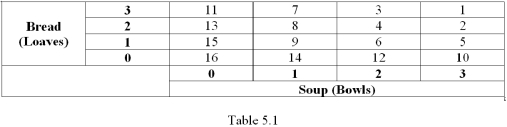
(Multiple Choice)
4.7/5 (38)
Refer to Figure 5.7.Which diagram best represents an income-consumption curve where bread is an inferior good? 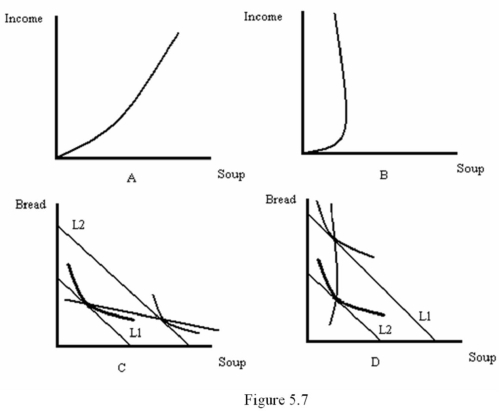
(Multiple Choice)
4.8/5 (39)
Choices that do not exhaust the consumer's budget lie to the ______ of the budget line.
(Multiple Choice)
4.9/5 (28)
Refer to Figure 5.7.Which diagram best represents an income-consumption curve where soup is a normal good? 
(Multiple Choice)
4.9/5 (41)
Refer to Figure 5.6.Which diagram shows an increase in income with bread being inferior and soup being normal? 
(Multiple Choice)
4.9/5 (40)
A curve that describes the relationship between the price of a good and the amount a particular consumer purchases (holding the consumer's income,preferences and all other prices fixed)is called:
(Multiple Choice)
4.8/5 (41)
Refer to Figure 5.4.Which consumption bundle would maximize the consumer's utility? 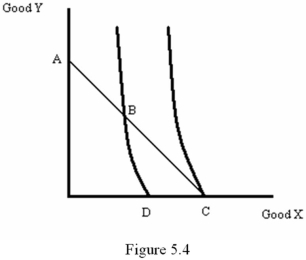
(Multiple Choice)
4.9/5 (37)
When the government provides food stamps to low-income households:
(Multiple Choice)
4.8/5 (41)
Suppose that an individual consumes just hamburgers and soft drinks.Using a carefully-labeled diagram,derive the price-consumption curve that would result from a decrease in the price of hamburgers.
(Essay)
4.9/5 (36)
Filters
- Essay(0)
- Multiple Choice(0)
- Short Answer(0)
- True False(0)
- Matching(0)