Exam 13: Correlation and Linear Regression
Exam 1: What Is Statistics59 Questions
Exam 2: Describing Data: Frequency Tables, Frequency Distributions, and Graphic Presentation78 Questions
Exam 3: Describing Data: Numerical Measures71 Questions
Exam 4: Describing Data: Displaying and Exploring Data64 Questions
Exam 5: A Survey of Probability Concepts79 Questions
Exam 6: Discrete Probability Distributions79 Questions
Exam 7: Continuous Probability Distributions82 Questions
Exam 8: Sampling Methods and the Central Limit Theorem71 Questions
Exam 9: Estimation and Confidence Intervals77 Questions
Exam 10: One-Sample Tests of Hypothesis69 Questions
Exam 11: Two-Sample Tests of Hypothesis62 Questions
Exam 12: Analysis of Variance80 Questions
Exam 13: Correlation and Linear Regression84 Questions
Exam 14: Multiple Regression Analysis81 Questions
Exam 15: Nonparametric Methods: Nominal Level Hypothesis Tests107 Questions
Exam 16: Nonparametric Methods: Analysis of Ordinal Data84 Questions
Exam 17: Index Numbers64 Questions
Exam 18: Time Series and Forecasting85 Questions
Exam 19: Statistical Process Control and Quality Management82 Questions
Exam 20: An Introduction to Decision Theory67 Questions
Select questions type
What is the null hypothesis to test the significance of the slope in a regression equation?
Free
(Multiple Choice)
4.9/5  (34)
(34)
Correct Answer: Verified
A
A regression analysis yields the following information:  = 2.21 + 1.49X; n = 10;
  = 166;
  = 32;
= 32;  = 134;
  = 31.6. Compute the 95% confidence interval when X = 4.
Free
(Multiple Choice)
4.8/5 (32)
Correct Answer:Verified
D
In the equation,  = a + bX,what is
  ?
?
Free
(Multiple Choice)
4.8/5 (37)
Correct Answer:Verified
C
What is the alternate hypothesis to test the significance of the slope in a regression equation?
(Multiple Choice)
4.8/5 (34)
A sales manager for an advertising agency believes that there is a relationship between the number of contacts that a salesperson makes and the amount of sales dollars earned. A regression analysis shows the following results:  What is the Y-intercept of the linear equation?
(Multiple Choice)
5.0/5 (33)
Which of the following is the same between a confidence interval and a prediction interval?
(Multiple Choice)
4.8/5 (29)
The Pearson product-moment correlation coefficient,r,requires that variables be measured with ________.
(Multiple Choice)
4.9/5 (42)
What is the variable used to predict another variable called?
(Multiple Choice)
4.8/5 (35)
Because the coefficient of determination is expressed as a percent,its value is between 0% and 100%.
(True/False)
4.9/5 (32)
If the correlation coefficient has a negative value,then the coefficient of determination ________.
(Multiple Choice)
4.8/5 (30)
In the regression equation,what does the letter a represent?
(Multiple Choice)
4.9/5 (28)
The coefficient of determination is the square root of the coefficient of correlation.
(True/False)
4.9/5 (34)
What is the chart called when the paired data (the dependent and independent variables)are plotted?
(Multiple Choice)
4.8/5 (36)
The standard error of estimate measures the accuracy of a prediction.
(True/False)
4.8/5 (42)
If all the plots on a scatter diagram lie on a straight line,what is the standard error of estimate?
(Multiple Choice)
4.9/5 (28)
Using the following information: 
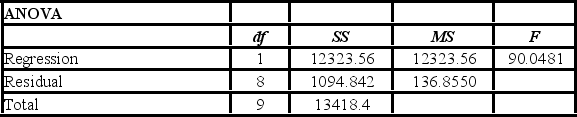 The regression equation is ________.
(Multiple Choice)
5.0/5 (37)
In the least squares equation,  = 10 + 20X,the value of 20 indicates ________.
(Multiple Choice)
4.8/5 (36)
Using the following information: 
 What is the coefficient of determination? Round the percentage to one decimal point.
(Multiple Choice)
4.8/5 (38)
A sales manager for an advertising agency believes there is a relationship between the number of contacts that a salesperson makes and the amount of sales dollars earned. A regression analysis shows the following results:  What is the regression equation?
(Multiple Choice)
4.8/5 (40)
Filters
- Essay(0)
- Multiple Choice(0)
- Short Answer(0)
- True False(0)
- Matching(0)