Exam 11: Two-Sample Tests of Hypothesis
Exam 1: What Is Statistics59 Questions
Exam 2: Describing Data: Frequency Tables, Frequency Distributions, and Graphic Presentation78 Questions
Exam 3: Describing Data: Numerical Measures71 Questions
Exam 4: Describing Data: Displaying and Exploring Data64 Questions
Exam 5: A Survey of Probability Concepts79 Questions
Exam 6: Discrete Probability Distributions79 Questions
Exam 7: Continuous Probability Distributions82 Questions
Exam 8: Sampling Methods and the Central Limit Theorem71 Questions
Exam 9: Estimation and Confidence Intervals77 Questions
Exam 10: One-Sample Tests of Hypothesis69 Questions
Exam 11: Two-Sample Tests of Hypothesis62 Questions
Exam 12: Analysis of Variance80 Questions
Exam 13: Correlation and Linear Regression84 Questions
Exam 14: Multiple Regression Analysis81 Questions
Exam 15: Nonparametric Methods: Nominal Level Hypothesis Tests107 Questions
Exam 16: Nonparametric Methods: Analysis of Ordinal Data84 Questions
Exam 17: Index Numbers64 Questions
Exam 18: Time Series and Forecasting85 Questions
Exam 19: Statistical Process Control and Quality Management82 Questions
Exam 20: An Introduction to Decision Theory67 Questions
Select questions type
A national manufacturer of ball bearings is experimenting with two different processes for producing precision ball bearings. It is important that the diameters be as close as possible to an industry standard. The output from each process is sampled,and the average error from the industry standard is measured in millimeters. The results are presented here.  The researcher is interested in determining whether there is evidence that the two processes yield different average errors. The population standard deviations are unknown but assumed equal. What is the alternate hypothesis?
Free
(Multiple Choice)
4.9/5  (37)
(37)
Correct Answer: Verified
B
We test for a hypothesized difference between two population means: H0: μ1 = μ2. The population standard deviations are unknown but assumed equal. The number of observations in the first sample is 15 and 12 in the second sample. How many degrees of freedom are associated with the critical value?
Free
(Multiple Choice)
4.8/5 (35)
Correct Answer:Verified
B
The results of a mathematics placement exam at two different campuses of Mercy College follow:  What is the null hypothesis if we want to test the hypothesis that the mean score on Campus 1 is higher than on Campus 2?
Free
(Multiple Choice)
4.9/5 (40)
Correct Answer:Verified
D
A company is researching the effectiveness of a new website design to decrease the time to access a website. Five website users were randomly selected,and their times (in seconds)to access the website with the old and new designs were recorded. To compare the times,they computed new website design time − old website design time. The results are shown here.  For a 0.01 significance level,what is the decision regarding the hypothesis that the training was effective in improving customer relationships?
(Multiple Choice)
4.8/5 (38)
Use the following table to determine whether or not there is a significant difference between the average hourly wages at two manufacturing companies.  The p-value is ________.
(Multiple Choice)
4.8/5 (40)
An investigation of the effectiveness of a training program to improve customer relationships included a pre-training and a post-training customer survey. To compare the differences they computed post-training survey score − pre-training survey score. Seven customers were randomly selected and completed both surveys. The results are shown here. 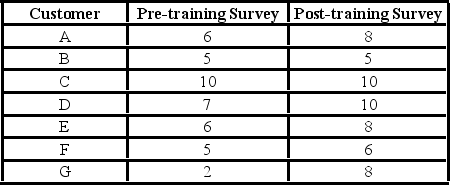 For a 0.05 significance level,what is the critical value?
(Multiple Choice)
4.9/5 (30)
An investigation of the effectiveness of a training program to improve customer relationships included a pre-training and a post-training customer survey. To compare the differences,they computed post-training survey score − pre-training survey score. Seven customers were randomly selected and completed both surveys. The results are shown here.  This analysis is an example of ________.
(Multiple Choice)
4.8/5 (31)
A recent study focused on the number of times men and women send a Twitter message in a day. The sample information is summarized here.  At the 0.01 significance level,we ask if there is a difference in the mean number of times men and women send a Twitter message in a day. What is the test statistic for this hypothesis?
(Multiple Choice)
4.8/5 (30)
A company is researching the effectiveness of a new website design to decrease the time to access a website. Five website users were randomly selected,and their times (in seconds)to access the website with the old and new designs were recorded. To compare the times,they computed new website design time − old website design time. The results follow.  What is the alternative hypothesis?
(Multiple Choice)
4.9/5 (30)
Assuming the population variances are known,the population variance of the difference between two means is ________.
(Multiple Choice)
4.9/5 (35)
Use the following table to determine whether or not there is a significant difference between the average hourly wages at two manufacturing companies.  What is the test statistic for the difference between the means?
(Multiple Choice)
4.7/5 (31)
The results of a mathematics placement exam at two different campuses of Mercy College follow:  What is the computed value of the test statistic?
(Multiple Choice)
4.9/5 (31)
A statistics professor wants to compare grades in two different classes of the same course. This is an example of a paired sample.
(True/False)
4.7/5 (32)
An investigation of the effectiveness of a training program to improve customer relationships included a pre-training and a post-training customer survey. To compare the differences they computed (post-training survey score − pre-training survey score). Seven customers were randomly selected and completed both surveys. The results are shown here.  For a 0.05 significance level,what is the decision regarding the hypothesis that the training was effective in improving customer relationships?
(Multiple Choice)
4.9/5 (32)
A company is researching the effectiveness of a new website design to decrease the time to access a website. Five website users were randomly selected,and their times (in seconds)to access the website with the old and new designs were recorded. To compare the times,they computed new website design time − old website design time. The results are shown here.  What is the value of the test statistic?
(Multiple Choice)
4.8/5 (36)
Accounting procedures allow a business to evaluate their inventory costs based on two methods: LIFO (last in first out)or FIFO (first in first out). A manufacturer evaluated its finished goods inventory (in $000s)for five products with the LIFO and FIFO methods. To analyze the difference,they computed FIFO − LIFO for each product. We would like to determine if the LIFO method results in a lower cost of inventory than the FIFO method.  What is the null hypothesis?
(Multiple Choice)
4.8/5 (41)
Accounting procedures allow a business to evaluate their inventory costs based on two methods: LIFO (last in first out)or FIFO (first in first out). A manufacturer evaluated its finished goods inventory (in $000s)for five products with the LIFO and FIFO methods. To analyze the difference,they computed FIFO − LIFO for each product. We would like to determine if the LIFO method results in a lower cost of inventory than the FIFO method.  If you use the 5% level of significance,what is the critical t-value?
(Multiple Choice)
4.8/5 (40)
Accounting procedures allow a business to evaluate its inventory costs based on two methods: LIFO (last in first out)or FIFO (first in first out). A manufacturer evaluated its finished goods inventory (in $000s)for five products with the LIFO and FIFO methods. To analyze the difference,they computed FIFO − LIFO for each product. Based on the following results,does the LIFO method result in a lower cost of inventory than the FIFO method?  What is the decision at the 5% level of significance?
(Multiple Choice)
4.8/5 (43)
A national manufacturer of ball bearings is experimenting with two different processes for producing precision ball bearings. It is important that the diameters be as close as possible to an industry standard. The output from each process is sampled,and the average error from the industry standard is measured in millimeters. The results are presented here.  The researcher is interested in determining whether there is evidence that the two processes yield different average errors. The population standard deviations are unknown but are assumed equal. This example is what type of test?
(Multiple Choice)
4.8/5 (32)
For a hypothesis test comparing two population means,the combined degrees of freedom are 24. Which of the following statements about the two sample sizes cannot be true? Assume the population standard deviations are equal.
(Multiple Choice)
4.8/5 (37)
Filters
- Essay(0)
- Multiple Choice(0)
- Short Answer(0)
- True False(0)
- Matching(0)