Exam 12: Analysis of Variance
Exam 1: What Is Statistics59 Questions
Exam 2: Describing Data: Frequency Tables, Frequency Distributions, and Graphic Presentation78 Questions
Exam 3: Describing Data: Numerical Measures71 Questions
Exam 4: Describing Data: Displaying and Exploring Data64 Questions
Exam 5: A Survey of Probability Concepts79 Questions
Exam 6: Discrete Probability Distributions79 Questions
Exam 7: Continuous Probability Distributions82 Questions
Exam 8: Sampling Methods and the Central Limit Theorem71 Questions
Exam 9: Estimation and Confidence Intervals77 Questions
Exam 10: One-Sample Tests of Hypothesis69 Questions
Exam 11: Two-Sample Tests of Hypothesis62 Questions
Exam 12: Analysis of Variance80 Questions
Exam 13: Correlation and Linear Regression84 Questions
Exam 14: Multiple Regression Analysis81 Questions
Exam 15: Nonparametric Methods: Nominal Level Hypothesis Tests107 Questions
Exam 16: Nonparametric Methods: Analysis of Ordinal Data84 Questions
Exam 17: Index Numbers64 Questions
Exam 18: Time Series and Forecasting85 Questions
Exam 19: Statistical Process Control and Quality Management82 Questions
Exam 20: An Introduction to Decision Theory67 Questions
Select questions type
When testing for differences between treatment means,the t-statistic is based on ________.
Free
(Multiple Choice)
5.0/5  (38)
(38)
Correct Answer: Verified
C
Two accounting professors decided to compare the variance of their grading procedures. To accomplish this,they each graded the same 10 exams,with the following results:  What is the critical value of F at the 0.02 level of significance?
Free
(Multiple Choice)
4.8/5 (41)
Correct Answer:Verified
B
One characteristic of the F-distribution is that the computed F can only range between -1 and +1.
Free
(True/False)
4.9/5 (27)
Correct Answer:Verified
False
For the hypothesis test,H0: σ12= σ22,with n1 = 10 and n2 = 10,the F-test statistic is 2.56. At the 0.02 level of significance,we would reject the null hypothesis.
(True/False)
4.8/5 (36)
ANOVA is a statistical approach used to determine whether or not ________.
(Multiple Choice)
4.8/5 (41)
If we want to determine which treatment means differ,we compute a confidence interval for the difference between each pair of means.
(True/False)
4.8/5 (36)
For an ANOVA test,rejecting the null hypothesis does not identify which treatment means differ significantly.
(True/False)
4.9/5 (26)
If there are five levels of Factor A and seven levels of Factor B for an ANOVA with interaction,what are the interaction degrees of freedom?
(Multiple Choice)
4.9/5 (28)
The college of business was interested in comparing the attendance for three different class times for a business statistics class. The data follow.  What is the treatment variable?
(Multiple Choice)
4.8/5 (47)
Two accounting professors decided to compare the variance of their grading procedures. To accomplish this,they each graded the same 10 exams,with the following results:  The calculated F ratio is ________.
(Multiple Choice)
4.8/5 (45)
A manufacturer of automobile transmissions uses three different processes. Management ordered a study of the production costs to see if there is a difference among the three processes. A summary of the findings is shown next. 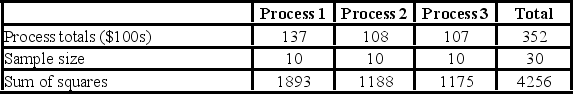 In an ANOVA table,what are the degrees of freedom for the treatment source of variation?
(Multiple Choice)
4.7/5 (25)
If a confidence interval for the difference between a pair of treatment means includes 0,then we reject the null hypothesis that there is no difference in the pair of treatment means.
(True/False)
4.8/5 (38)
Two accounting professors decided to compare the variance of their grading procedures. To accomplish this,they each graded the same 10 exams,with the following results:  At the 2% level of significance,what is the decision?
(Multiple Choice)
4.9/5 (30)
The annual dividend rates for a random sample of 16 companies in three different industries,utilities,banking,and insurance,were recorded. The ANOVA comparing the mean annual dividend rate among three industries rejected the null hypothesis that the dividend rates were equal. The mean square error (MSE)was 3.36. The following table summarized the results: 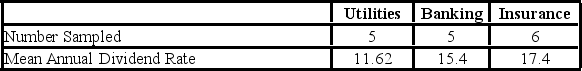 Based on the comparison between the mean annual dividend rate for companies in utilities and banking,the 95% confidence interval shows an interval of 1.28 to 6.28 for the difference. This result indicates that ________.
(Multiple Choice)
4.8/5 (28)
An ANOVA procedure is applied to data obtained from four distinct populations. The samples,each comprised of 15 observations,were taken from the four populations. The degrees of freedom for the numerator and denominator for the critical value of are ________.
(Multiple Choice)
4.8/5 (35)
A random sample of 40 companies with assets over $10 million was surveyed and asked to indicate their industry and annual computer technology expense. The ANOVA comparing the average computer technology expense among three industries rejected the null hypothesis. The mean square error (MSE)was 195. The following table summarized the results:  Based on the comparison between the mean annual computer technology expense for companies in the tax service and food service industries,the 95% confidence interval shows an interval of −5.85 to 14.85 for the difference. This result indicates that ________.
(Multiple Choice)
4.8/5 (34)
The null hypothesis for an ANOVA analysis comparing four treatment means is rejected. The four sample means are  = 10,
= 10,  = 12,
= 12,  = 15,
= 15,  = 18. The sample size for each treatment is the same. If (
  -
-  )is significantly different from zero,then ________.
(Multiple Choice)
4.8/5 (26)
The college of business was interested in comparing the attendance for three different class times for a business statistics class. The data follow.  What is the critical statistic for testing the hypothesis of equal treatment means at the 0.05 significance level?
(Multiple Choice)
4.8/5 (37)
An electronics company wants to compare the quality of their cell phones to the cell phones from three competitors. They sample 10 phones from each company and count the number of defects for each phone. If ANOVA was used to compare the average number of defects,then the treatments would be defined as ________.
(Multiple Choice)
4.8/5 (32)
Filters
- Essay(0)
- Multiple Choice(0)
- Short Answer(0)
- True False(0)
- Matching(0)