Exam 13: Correlation and Linear Regression
Exam 1: What Is Statistics59 Questions
Exam 2: Describing Data: Frequency Tables, Frequency Distributions, and Graphic Presentation78 Questions
Exam 3: Describing Data: Numerical Measures71 Questions
Exam 4: Describing Data: Displaying and Exploring Data64 Questions
Exam 5: A Survey of Probability Concepts79 Questions
Exam 6: Discrete Probability Distributions79 Questions
Exam 7: Continuous Probability Distributions82 Questions
Exam 8: Sampling Methods and the Central Limit Theorem71 Questions
Exam 9: Estimation and Confidence Intervals77 Questions
Exam 10: One-Sample Tests of Hypothesis69 Questions
Exam 11: Two-Sample Tests of Hypothesis62 Questions
Exam 12: Analysis of Variance80 Questions
Exam 13: Correlation and Linear Regression84 Questions
Exam 14: Multiple Regression Analysis81 Questions
Exam 15: Nonparametric Methods: Nominal Level Hypothesis Tests107 Questions
Exam 16: Nonparametric Methods: Analysis of Ordinal Data84 Questions
Exam 17: Index Numbers64 Questions
Exam 18: Time Series and Forecasting85 Questions
Exam 19: Statistical Process Control and Quality Management82 Questions
Exam 20: An Introduction to Decision Theory67 Questions
Select questions type
In the regression equation,what does the letter X represent?
(Multiple Choice)
4.8/5  (35)
(35)
Using the following information: 
 Estimate the value of
  when X = 4.
(Multiple Choice)
4.8/5 (31)
One assumption underlying linear regression is that the X values are normally distributed.
(True/False)
4.8/5 (42)
Consider the following regression analysis between sales (Y in $1,000)and social media advertising (X in dollars).  = 55,000 + 7X The regression equation implies that an ________.
(Multiple Choice)
4.9/5 (27)
A sales manager for an advertising agency believes there is a relationship between the number of contacts that a salesperson makes and the amount of sales dollars earned. A regression analysis shows the following results: 

 = 33.4.
  = 2814.4. Rounding to one decimal place,the 95% confidence interval for 30 calls is ________.
(Multiple Choice)
4.8/5 (31)
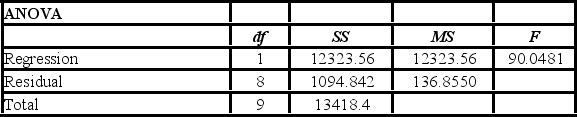
A sales manager for an advertising agency believes there is a relationship between the number of contacts that a salesperson makes and the amount of sales dollars earned. A regression ANOVA shows the following results:  What is the value of the standard error of estimate?
(Multiple Choice)
4.9/5 (34)
If r = 0.65,what does the coefficient of determination equal?
(Multiple Choice)
5.0/5 (36)
In the regression equation,what does the letter b represent?
(Multiple Choice)
4.8/5 (27)
If the coefficient of determination is 0.94,what can we say about the relationship between two variables?
(Multiple Choice)
4.8/5 (27)
What is the range of values for the coefficient of determination?
(Multiple Choice)
4.8/5 (35)
The regression equation is Ŷ = 29.29 − 0.96X,the sample size is 8,and the standard error of the slope is 0.22. What is the critical value to test the significance of the slope at the 0.01 significance level?
(Multiple Choice)
4.7/5 (32)
What does the coefficient of determination equal if r = 0.89?
(Multiple Choice)
4.9/5 (38)
Assume the least squares equation is  = 10 + 20X. What does the value of 10 in the equation indicate?
(Multiple Choice)
4.9/5 (41)
A sales manager for an advertising agency believes there is a relationship between the number of contacts that a salesperson makes and the amount of sales dollars earned. A regression analysis shows the following results:  What is the standard error of the slope?
(Multiple Choice)
4.7/5 (40)
In the regression equation,what does the letter Y represent?
(Multiple Choice)
4.8/5 (32)
In regression,the difference between the confidence interval and prediction interval formulas is ________.
(Multiple Choice)
4.8/5 (36)
A sales manager for an advertising agency believes there is a relationship between the number of contacts that a salesperson makes and the amount of sales dollars earned. A regression ANOVA shows the following results:  What is the value of the coefficient of correlation?
(Multiple Choice)
4.9/5 (26)
A scatter diagram is a graph that portrays the correlation between a dependent variable and an independent variable.
(True/False)
4.9/5 (42)
The values of a and b in the regression equation are called the regression coefficients.
(True/False)
4.7/5 (34)
Filters
- Essay(0)
- Multiple Choice(0)
- Short Answer(0)
- True False(0)
- Matching(0)