Exam 12: Analysis of Variance
Exam 1: What Is Statistics59 Questions
Exam 2: Describing Data: Frequency Tables, Frequency Distributions, and Graphic Presentation78 Questions
Exam 3: Describing Data: Numerical Measures71 Questions
Exam 4: Describing Data: Displaying and Exploring Data64 Questions
Exam 5: A Survey of Probability Concepts79 Questions
Exam 6: Discrete Probability Distributions79 Questions
Exam 7: Continuous Probability Distributions82 Questions
Exam 8: Sampling Methods and the Central Limit Theorem71 Questions
Exam 9: Estimation and Confidence Intervals77 Questions
Exam 10: One-Sample Tests of Hypothesis69 Questions
Exam 11: Two-Sample Tests of Hypothesis62 Questions
Exam 12: Analysis of Variance80 Questions
Exam 13: Correlation and Linear Regression84 Questions
Exam 14: Multiple Regression Analysis81 Questions
Exam 15: Nonparametric Methods: Nominal Level Hypothesis Tests107 Questions
Exam 16: Nonparametric Methods: Analysis of Ordinal Data84 Questions
Exam 17: Index Numbers64 Questions
Exam 18: Time Series and Forecasting85 Questions
Exam 19: Statistical Process Control and Quality Management82 Questions
Exam 20: An Introduction to Decision Theory67 Questions
Select questions type
A random sample of 40 companies with assets over $10 million was surveyed and asked to indicate their industry and annual computer technology expense. The ANOVA comparing the average computer technology expense among three industries rejected the null hypothesis. The mean square error (MSE)was 195. The following table summarized the results: 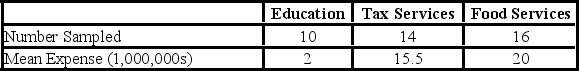 Based on the comparison between the mean annual computer technology expense for companies in the education and tax services industries,________.
(Multiple Choice)
4.9/5  (40)
(40)
The college of business was interested in comparing the interaction of academic status and class time on class attendance. Three different classes were sampled for each cell in the table. The means for each cell follow.  What are the total degrees of freedom?
(Multiple Choice)
4.8/5 (37)
A random sample of 40 companies with assets over $10 million was surveyed and asked to indicate their industry and annual computer technology expense. The ANOVA comparing the average computer technology expense among three industries rejected the null hypothesis. The mean square error (MSE)was 195. The following table summarized the results:  When comparing the mean annual computer technology expense for companies in the education and tax services industries,which of the following 95% confidence interval can be constructed?
(Multiple Choice)
4.8/5 (32)
The annual dividend rates for a random sample of 16 companies in three different industries,utilities,banking,and insurance,were recorded. The ANOVA comparing the mean annual dividend rate among three industries rejected the null hypothesis that the dividend rates were equal. The mean square error (MSE)was 3.36. The following table summarized the results: 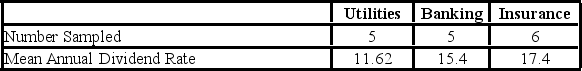 Based on the comparison between the mean annual dividend rate for companies in the utilities and insurance industries,________.
(Multiple Choice)
4.9/5 (41)
When the null hypothesis for an ANOVA analysis comparing four treatment means is rejected,________.
(Multiple Choice)
4.7/5 (40)
A manufacturer of automobile transmissions uses two different processes. Management ordered a study of the production costs to see if there is a difference between the two processes. A summary of the findings is shown next. 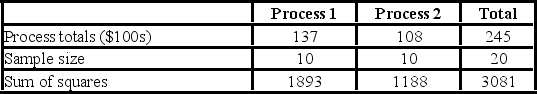 What is the critical value of F at the 1% level of significance?
(Multiple Choice)
4.8/5 (50)
Two accounting professors decided to compare the variance of their grading procedures. To accomplish this,they each graded the same 10 exams,with the following results:  At the 10% level of significance,what is the decision regarding the null hypothesis?
(Multiple Choice)
4.9/5 (41)
Two accounting professors decided to compare the variance of their grading procedures. To accomplish this,they each graded the same 10 exams,with the following results:  What are the degrees of freedom for the numerator of the F ratio?
(Multiple Choice)
4.9/5 (42)
Several employees have submitted different methods of assembling a subassembly. Sample data for each method are:  How many treatments are there?
(Multiple Choice)
4.7/5 (29)
Given the following ANOVA table for three treatments each with six observations:  What is the treatment mean square?
(Multiple Choice)
4.9/5 (41)
Two accounting professors decided to compare the variance of their grading procedures. To accomplish this,they each graded the same 10 exams,with the following results:  What is the critical value of F at the 0.1 level of significance?
(Multiple Choice)
4.8/5 (32)
Two accounting professors decided to compare the variance of their grading procedures. To accomplish this,they each graded the same 10 exams,with the following results:  What are the degrees of freedom for the denominator of the F ratio?
(Multiple Choice)
4.9/5 (31)
Given the following ANOVA table for three treatments each with six observations:  What is the decision regarding the null hypothesis at the 5% significance level?
(Multiple Choice)
5.0/5 (33)
The following is the information for a completely randomized experimental design involving four treatments,where 12 observations were recorded for each treatment for a total of 48 observations. SST = 210 (Sum of Squares Between Groups); SS Total = 840 (Sum of Squares Total). The computed value of F,or the test statistic,is ________.
(Multiple Choice)
4.7/5 (36)
When testing for differences between treatment means,the degrees of freedom for the t-statistic are ________.
(Multiple Choice)
4.8/5 (26)
The college of business was interested in comparing the interaction of academic status and class time on class attendance. Three different classes were sampled for each cell in the table. The means for each cell follow.  What are the total degrees of freedom?
(Multiple Choice)
4.9/5 (38)
A random sample of 30 executives from companies with assets over $1 million was selected and asked for their annual income and level of education. The ANOVA comparing the average income among three levels of education rejected the null hypothesis. The mean square error (MSE)was 243.7. The following table summarized the results :  When comparing the mean annual incomes for executives with a high school education or less and those with an undergraduate degree,the 95% confidence interval shows an interval of 11.7 to 42.7 for the difference. This result indicates that ________.
(Multiple Choice)
4.7/5 (46)
Filters
- Essay(0)
- Multiple Choice(0)
- Short Answer(0)
- True False(0)
- Matching(0)