Exam 4: Descriptive Statistics
Exam 1: Overview of Statistics52 Questions
Exam 2: Data Collection111 Questions
Exam 3: Describing Data Visually108 Questions
Exam 4: Descriptive Statistics150 Questions
Exam 5: Probability123 Questions
Exam 6: Discrete Probability Distributions126 Questions
Exam 7: Continuous Probability Distributions120 Questions
Exam 8: Sampling Distributions and Estimation106 Questions
Exam 9: One-Sample Hypothesis Tests147 Questions
Exam 10: Two-Sample Hypothesis Tests113 Questions
Exam 11: Analysis of Variance126 Questions
Exam 12: Simple Regression135 Questions
Exam 13: Multiple Regression130 Questions
Exam 14: Time Series Analysis114 Questions
Exam 15: Chi-Square Tests99 Questions
Exam 16: Nonparametric Tests85 Questions
Exam 17: Quality Management108 Questions
Select questions type
A team of introductory statistics students went to a grocery store and recorded the total calories and fat calories for various kinds of soup. They produced a table of statistics and two dot plots. Write a succinct summary of the center, variability, and shape for each data set. Note: TrimMean is the 5 percent trimmed mean (removing the smallest 5 percent and the largest 5 percent of the values, rounded to the nearest integer).
Statistic Total Calories Fat Calories Sample size 30 30 Mean 96.63 27.83 Median 90 20 TrimMean 95.08 26.35 St Dev 26.91 19.46 Min 45 0 Max 180 70 80 15 105 36.25 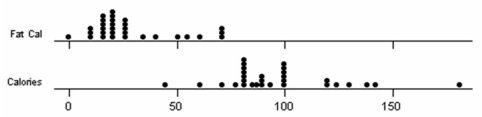
(Essay)
4.8/5  (32)
(32)
Three randomly chosen Colorado students were asked how many times they went rock climbing last month. Their replies were 5, 6, 7. The coefficient of variation is:
(Multiple Choice)
4.9/5 (38)
The owner of a chicken farm kept track of each hen's eating and egg production for many months, with the results below. Which has more variation, feed consumption or egg output?
Feed Consumption Output of Eggs Mean 84 grams/day 24 eggs/mo. Standard Deviation 12 grams/day 6 eggs / mo.
(Essay)
4.9/5 (38)
Three randomly chosen Seattle students were asked how many round trips they made to Canada last year. Their replies were 3, 4, 5. The geometric mean is:
(Multiple Choice)
4.8/5 (30)
Referring to this box plot of ice cream fat content, the mean would exceed the median. 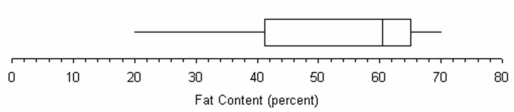
(True/False)
4.8/5 (40)
The 25th percentile for waiting time in a doctor's office is 19 minutes. The 75th percentile is 31 minutes. The interquartile range is:
(Multiple Choice)
4.8/5 (35)
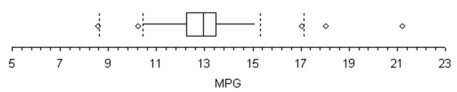
Craig operates a part-time snow-plowing business using a 2002 GMC 2500 HD extended cab short box truck. Describe Craig's gasoline mileage based on this box plot of 195 tanks of gas.
(Essay)
4.8/5 (30)
In Osaka, Japan, stock brokers earn ×6000 per hour on the average, with a standard deviation of ×1200. In Stuttgart, Germany, stock brokers earn an average of €18 per hour with a standard deviation of €6. In which country is the variation in wages greatest?
(Essay)
4.7/5 (25)
Referring to this box plot of ice cream fat content, the skewness would be negative. 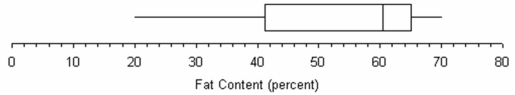
(True/False)
4.7/5 (37)
So far this year, stock A has had a mean price of $6.58 per share with a standard deviation of $1.88, while stock B has had a mean price of $10.57 per share with a standard deviation of $3.02. Which stock is more volatile?
(Multiple Choice)
4.8/5 (33)
A sample of 50 breakfast customers of McDonald's showed the spending below. Which statement is least likely to be correct? 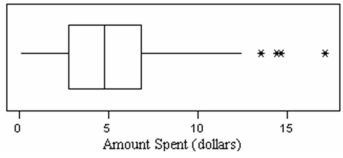
(Multiple Choice)
4.9/5 (34)
Twelve randomly chosen students were asked how many times they had missed class during a certain semester, with this result: 3, 2, 1, 2, 1, 5, 9, 1, 2, 3, 3, 10. The median is:
(Multiple Choice)
4.8/5 (36)
Below are shown a dot plot and summary statistics for a random sample of 34 shower heads. The measurements are maximum flow rates (in gallons per minute) at pressure of 80 pounds per square inch. Use the data to illustrate the difference between the two alternative definitions of "outlier," and make any other comments you feel are relevant. Note: TrimMean removes the smallest 5 percent and the largest 5 percent of the values.
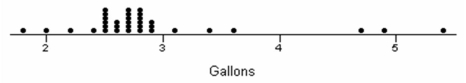 Sample size 34 Mean 2.882 Median 2.700 TrimMean 2.797 St Dev 0.750 Min 1.8 Max 5.4 2.500 2.900
(Essay)
4.8/5 (36)
Ten randomly chosen students at a certain university were asked how many times they smoked marijuana during the preceding week. Their answers were 0, 8, 0, 0, 2, 4, 0, 0, 6, 0. A campus newspaper article appeared, with the headline "Average Student Uses No Pot." Is this a fair assessment of central tendency? Discuss the alternatives.
(Essay)
4.7/5 (33)
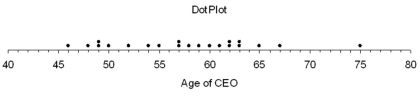
Below are the ages of 21 CEOs. Find the mean, median, and mode. Are there any outliers? Explain.
46, 48, 49, 49, 50, 52, 54, 55, 57, 57, 58, 59, 60, 61, 62, 62, 63, 63, 65, 67, 75
(Essay)
4.8/5 (33)
Referring to this box plot of ice cream fat content, the median seems more "typical" of fat content than the midrange as a measure of center. 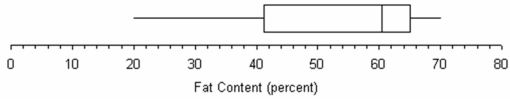
(True/False)
4.9/5 (44)
A certain health maintenance organization (HMO) examined the number of office visits by each of its members in the last year. For this data set, we would anticipate that the geometric mean would be
(Multiple Choice)
4.9/5 (31)
Filters
- Essay(0)
- Multiple Choice(0)
- Short Answer(0)
- True False(0)
- Matching(0)