Exam 4: Descriptive Statistics
Exam 1: Overview of Statistics52 Questions
Exam 2: Data Collection111 Questions
Exam 3: Describing Data Visually108 Questions
Exam 4: Descriptive Statistics150 Questions
Exam 5: Probability123 Questions
Exam 6: Discrete Probability Distributions126 Questions
Exam 7: Continuous Probability Distributions120 Questions
Exam 8: Sampling Distributions and Estimation106 Questions
Exam 9: One-Sample Hypothesis Tests147 Questions
Exam 10: Two-Sample Hypothesis Tests113 Questions
Exam 11: Analysis of Variance126 Questions
Exam 12: Simple Regression135 Questions
Exam 13: Multiple Regression130 Questions
Exam 14: Time Series Analysis114 Questions
Exam 15: Chi-Square Tests99 Questions
Exam 16: Nonparametric Tests85 Questions
Exam 17: Quality Management108 Questions
Select questions type
In a left-skewed distribution, we expect that the median will be greater than the mean.
(True/False)
4.8/5  (30)
(30)
The Excel formula for the standard deviation of a sample array named Data is:
(Multiple Choice)
4.8/5 (34)
Consider the following data: 6, 7, 17, 51, 3, 17, 23, and 69. The range and the median are:
(Multiple Choice)
5.0/5 (40)
The quartiles of a distribution are most clearly revealed in which display?
(Multiple Choice)
4.9/5 (38)
Kurtosis cannot be judged accurately by looking at a histogram.
(True/False)
4.9/5 (35)
A certain health maintenance organization (HMO) examined the number of office visits by its members in the last year. For this data set, the mean is probably not a very good measure of a "typical" person's office visits.
(True/False)
4.7/5 (34)
Which Excel function is designed to calculate z = (x - μ)/σ for a column of data?
(Multiple Choice)
4.9/5 (42)
In a sample of 10,000 observations from a normal population, how many would you expect to lie beyond three standard deviations of the mean?
(Multiple Choice)
4.7/5 (35)
Chebyshev's Theorem says that at least 95 percent of the data lie within 2 standard deviations of the mean.
(True/False)
4.8/5 (39)
A reporter for the campus paper asked five randomly chosen students how many occupants, including the driver, ride to school in their cars. The responses were 1, 1, 1, 1, 6. The coefficient of variation is:
(Multiple Choice)
4.9/5 (38)
Here are descriptive statistics from Excel for annual per-pupil expenditures in 94 Ohio cities and home sizes in a certain neighborhood. Very briefly compare the variability and shape of the two data sets.
Expenditure per Pupil (dollars) Home Size (sqft) Mean 2724.606383 Mean 2231.40857 Median 2508.5 Median 2217 Mode 2506 Mode 2117 Standard deviation 1095.217916 Standard deviation 249.3151 Kurtosis 43.9989606 Kurtosis 0.52824942 Skewness 6.260249912 Skewness 0.35668642 Range 9310 Range 1315.4 Minimum 1916 Minimum 1593 Maximum 11226 Maximum 2908 Count 94 Count 105
(Essay)
4.7/5 (37)
Outliers are data values that fall beyond ±2 standard deviations from the mean.
(True/False)
4.8/5 (33)
Here are statistics on order sizes of Megalith Construction Supply's shipments of two kinds of construction materials last year. Girders Rivets Mean 160 2800 Std. Dev. 48 702 Which order sizes have greater variability?
(Multiple Choice)
4.8/5 (33)
If there are 19 data values, the median will have 10 values above it and 9 below it since n is odd.
(True/False)
4.9/5 (34)
Given the data set 10, 5, 2, 6, 3, 4, 20, the median value is 5.
(True/False)
4.9/5 (42)
What does the graph below (profit/sales ratios for 25 Fortune 500 companies) reveal? 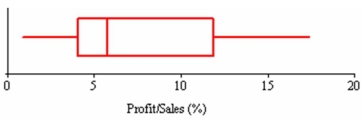
(Multiple Choice)
4.8/5 (43)
Filters
- Essay(0)
- Multiple Choice(0)
- Short Answer(0)
- True False(0)
- Matching(0)