Exam 12: Prediction
Exam 1: Displaying the Order in a Group of Numbers68 Questions
Exam 2: Central Tendency and Variability69 Questions
Exam 3: Some Key Ingredients for Inferential Statistics: Z Scores,the Normal Curve, Sample Versus Population, and Probability73 Questions
Exam 4: Introduction to Hypothesis Testing71 Questions
Exam 5: Hypothesis Tests With Means of Samples71 Questions
Exam 6: Making Sense of Statistical Significance:decision Errors, Effect Size, and Statistical Power69 Questions
Exam 7: Introduction to T Tests: Single Sample and Dependent Means72 Questions
Exam 8: The T Test for Independent Means72 Questions
Exam 9: Introduction to the Analysis of Variance84 Questions
Exam 10: Factorial Analysis of Variance70 Questions
Exam 11: Correlation71 Questions
Exam 12: Prediction73 Questions
Exam 13: Chi-Square Tests71 Questions
Exam 14: Strategies When Population Distributions Are Not Normal: Data Transformations and Rank-Order Tests71 Questions
Exam 15: The General Linear Model and Making Sense of Advanced Statistical Procedures in Research Articles64 Questions
Select questions type
based on the following data for variables X and Y. 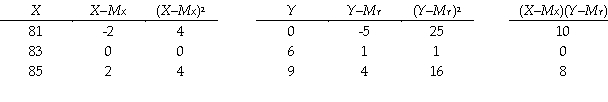 -The regression constant for the best linear prediction rule is __________.(Give a number.)
(Short Answer)
4.8/5  (36)
(36)
In a multiple regression situation with two predictors,the correlation of the first predictor with the criterion is .13; the correlation of the second predictor variable with the criterion is .12.Because the two predictor variables are correlated with each other,the multiple correlation coefficient will be __________ .25.
(Short Answer)
4.8/5 (33)
A social psychologist conducted a study of whether similarity to a potential date (X)predicted attraction to that potential date (Y).The results for four participants follow.  a.Figure the linear prediction rule.
b.Make a graph with the regression line.
c.Figure the standardized regression coefficient.
d.Explain the logic of what you did to someone who is familiar with correlation,but who knows nothing about prediction.Be sure your answer explains the ideas of prediction,linear prediction rule,best linear prediction rule,the regression line,and the standardized regression coefficient.
e.Advanced topic: Figure the proportionate reduction in error using sums of squared errors.
f.Advanced topic: Explain the logic behind how you figured the proportionate reduction in error.
a.Figure the linear prediction rule.
b.Make a graph with the regression line.
c.Figure the standardized regression coefficient.
d.Explain the logic of what you did to someone who is familiar with correlation,but who knows nothing about prediction.Be sure your answer explains the ideas of prediction,linear prediction rule,best linear prediction rule,the regression line,and the standardized regression coefficient.
e.Advanced topic: Figure the proportionate reduction in error using sums of squared errors.
f.Advanced topic: Explain the logic behind how you figured the proportionate reduction in error.
(Essay)
4.8/5 (39)
A psychologist surveys a group of working married women to see if contribution to income (X)predicts contribution to housework (Y).(Contributions are proportions,but they have been converted to whole numbers to make figuring easier.)The results for four women follow:  a.Figure the linear prediction rule.
b.Make a graph with the regression line.
c.Figure the standardized regression coefficient.
d.Explain the logic of what you did to someone who is familiar with correlation,but who knows nothing about prediction.Be sure your answer explains the ideas of prediction,linear prediction rule,best linear prediction rule,the regression line,and the standardized regression coefficient.
e.Advanced topic: Figure the proportionate reduction in error using sums of squared errors.
f.Advanced topic: Explain the logic behind how you figured the proportionate reduction in error.
a.Figure the linear prediction rule.
b.Make a graph with the regression line.
c.Figure the standardized regression coefficient.
d.Explain the logic of what you did to someone who is familiar with correlation,but who knows nothing about prediction.Be sure your answer explains the ideas of prediction,linear prediction rule,best linear prediction rule,the regression line,and the standardized regression coefficient.
e.Advanced topic: Figure the proportionate reduction in error using sums of squared errors.
f.Advanced topic: Explain the logic behind how you figured the proportionate reduction in error.
(Essay)
4.8/5 (40)
In a bivariate linear prediction,the null hypothesis is that
(Multiple Choice)
4.8/5 (34)
The standardized regression coefficient in a bivariate linear prediction rule equals
(Multiple Choice)
4.8/5 (35)
In a linear prediction rule using a standardized regression coefficient,
(Multiple Choice)
4.9/5 (46)
Researchers recommend comparing __________ to __________ when determining a predictor's relative importance.(Give symbols.)
(Short Answer)
4.9/5 (36)
The regression constant in the best linear prediction rule is
(Multiple Choice)
4.9/5 (38)
Advanced topic: What is the formula for the proportionate reduction in error?
(Multiple Choice)
4.8/5 (45)
Which limitation is applicable to both correlation and regression?
(Multiple Choice)
4.8/5 (31)
A social psychologist examining whether length of court trials (X)predicts length of time for juries to come to a decision (Y),reports the following results for the first four trials studied.  a.Figure the linear prediction rule.
b.Make a graph with the regression line.
c.Figure the standardized regression coefficient.
d.Explain the logic of what you did to someone who is familiar with correlation,but who knows nothing about prediction.Be sure your answer explains the ideas of prediction,linear prediction rule,best linear prediction rule,the regression line,and the standardized regression coefficient.
e.Advanced topic: Figure the proportionate reduction in error using sums of squared errors.
f.Advanced topic: Explain the logic behind how you figured the proportionate reduction in error.
a.Figure the linear prediction rule.
b.Make a graph with the regression line.
c.Figure the standardized regression coefficient.
d.Explain the logic of what you did to someone who is familiar with correlation,but who knows nothing about prediction.Be sure your answer explains the ideas of prediction,linear prediction rule,best linear prediction rule,the regression line,and the standardized regression coefficient.
e.Advanced topic: Figure the proportionate reduction in error using sums of squared errors.
f.Advanced topic: Explain the logic behind how you figured the proportionate reduction in error.
(Essay)
4.9/5 (35)
Filters
- Essay(0)
- Multiple Choice(0)
- Short Answer(0)
- True False(0)
- Matching(0)