Exam 3: Measurement of Cost Behaviour
Exam 1: Management Accounting and Management Decisions90 Questions
Exam 2: Cost Behaviour and Cost-Volume Relationships96 Questions
Exam 3: Measurement of Cost Behaviour97 Questions
Exam 4: Cost Management Systems134 Questions
Exam 5: Cost Allocation and Activity-Based Costing Systems128 Questions
Exam 6: Job-Costing Systems88 Questions
Exam 7: Process-Costing Systems82 Questions
Exam 8: Relevant Information and Decision Making: Marketing Decisions100 Questions
Exam 9: Relevant Information and Decision Making: Production Decisions111 Questions
Exam 10: Capital Budgeting Decisions116 Questions
Exam 11: The Master Budget112 Questions
Exam 12: Flexible Budgets and Variance Analysis106 Questions
Exam 13: Management Control Systems, the Balanced Scorecard, and Responsibility Accounting94 Questions
Exam 14: Management Control in Decentralized Organizations103 Questions
Select questions type
Committed fixed costs can be altered by management if management decides that different levels of spending are desirable.
(True/False)
5.0/5  (33)
(33)
Costs that may be essential to the long run achievement of the organization's goals, but that managers can almost reduce to zero in the short run, are called
(Multiple Choice)
4.9/5 (35)
________ selects a volume-related cost driver and classifies each account as a variable or fixed cost.
(Multiple Choice)
4.8/5 (42)
Account analysis is the process of selecting a volume-related cost driver and classifying each account as a variable or fixed cost.
(True/False)
4.7/5 (31)
________ measures a cost function objectively (with statistics rather than human eyesight) using all the data available.
(Multiple Choice)
4.8/5 (40)
Presented below is the production data for the last six months of the year for the mixed costs incurred by Vignovich Company.
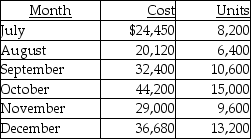 Vignovich Company uses the high-low method to analyze mixed costs.
-The variable cost per unit is
Vignovich Company uses the high-low method to analyze mixed costs.
-The variable cost per unit is
(Multiple Choice)
4.9/5 (38)
The Schmidt Company used regression analysis to predict the annual cost of indirect materials. The results were as follows: 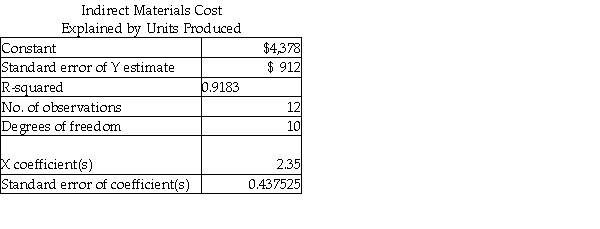 -The variable cost per unit of product is:
(Multiple Choice)
4.9/5 (24)
Which of the following methods of measuring cost functions is the most subjective?
(Multiple Choice)
4.7/5 (36)
________ is a method in which the cost analyst draws a straight line through a plot of all the available data.
(Multiple Choice)
4.9/5 (43)
Presented below is the production data for the last six months of the year for the mixed costs incurred by Vignovich Company.
Vignovich Company uses the high-low method to analyze mixed costs.
-The total fixed cost is
(Multiple Choice)
4.8/5 (30)
The Stewart Company used regression analysis to predict the annual cost of utilities. The results were as follows: 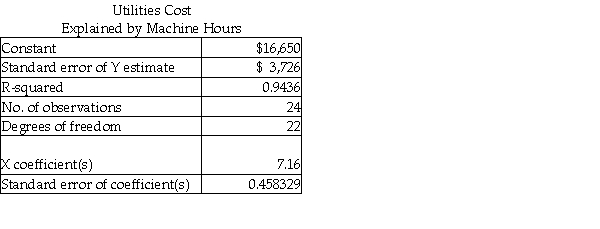 -The coefficient of determination is
(Multiple Choice)
4.8/5 (42)
Conquest Industries made the following observations of supply costs at different production volume levels:  a. Using the method of least squares, develop an estimate of total fixed costs and variable cost per unit. (Round your estimate of variable cost per unit to two decimal points.)
b. Develop a cost function to estimate supply cost at different volume levels and then estimate supply cost if production is expected to be 700 units.
c. If the coefficient of correlation was .95, what percentage of the change in supply cost could be explained by changes in production volume?
a. Using the method of least squares, develop an estimate of total fixed costs and variable cost per unit. (Round your estimate of variable cost per unit to two decimal points.)
b. Develop a cost function to estimate supply cost at different volume levels and then estimate supply cost if production is expected to be 700 units.
c. If the coefficient of correlation was .95, what percentage of the change in supply cost could be explained by changes in production volume?
(Essay)
4.8/5 (39)
Strategic decisions about the scale and scope of an organization's activities generally result in fixed levels of
(Multiple Choice)
4.7/5 (32)
An algebraic equation used by managers to describe the relationship between a cost and its cost driver(s) is called a
(Multiple Choice)
5.0/5 (41)
In order to better predict setup costs, the plant manager has asked the computer centre to use the least squares method to generate a printout for use in estimating setup costs.
The following computer printout was generated and given to the plant manager.  The plant manager brought the printout to you and said, "How am I supposed to use this to estimate setup costs? This printout is worthless!"
a. Explain how the printout information can be used to estimate setup costs.
b. Estimate setup costs if 30 setups are expected next month.
c. What percentage change in setup costs can be explained by changes in the number of setups?
The plant manager brought the printout to you and said, "How am I supposed to use this to estimate setup costs? This printout is worthless!"
a. Explain how the printout information can be used to estimate setup costs.
b. Estimate setup costs if 30 setups are expected next month.
c. What percentage change in setup costs can be explained by changes in the number of setups?
(Essay)
4.8/5 (25)
The Schmidt Company used regression analysis to predict the annual cost of indirect materials. The results were as follows:
-The linear cost function is
(Multiple Choice)
4.9/5 (31)
The Stewart Company used regression analysis to predict the annual cost of utilities. The results were as follows:
-The linear cost function is
(Multiple Choice)
4.8/5 (42)
One of the simplest methods to measure a linear cost function from past data is the
(Multiple Choice)
4.8/5 (37)
Filters
- Essay(0)
- Multiple Choice(0)
- Short Answer(0)
- True False(0)
- Matching(0)