Exam 18: Using Input Market Analysis
Exam 1: An Introduction to Microeconomics72 Questions
Exam 2: Supply and Demand97 Questions
Exam 3: The Theory of Consumer Choice97 Questions
Exam 4: Individual and Market Demand99 Questions
Exam 5: Using Consumer Choice Theory75 Questions
Exam 6: Exchange, Efficiency, and Prices82 Questions
Exam 7: Production112 Questions
Exam 8: The Cost of Production121 Questions
Exam 9: Profit Maximization in Perfectly Competitive Markets99 Questions
Exam 10: Using the Competitive Model82 Questions
Exam 11: Monopoly115 Questions
Exam 12: Product Pricing With Monopoly Power88 Questions
Exam 13: Monopolistic Competition and Oligopoly98 Questions
Exam 14: Game Theory and the Economics of Information88 Questions
Exam 15: Using Noncompetitive Market Models77 Questions
Exam 16: Employment and Pricing of Inputs100 Questions
Exam 17: Wages, Rent, Interest, and Profit92 Questions
Exam 18: Using Input Market Analysis83 Questions
Exam 19: General Equilibrium Analysis and Economic Efficiency93 Questions
Exam 20: Public Goods and Externalities101 Questions
Select questions type
Use the following figure to answer the question : Figure 18-2 :
shows the demand and supply curves of labor.A per-unit tax imposed on the wage income of the employees shifts the supply curve of labor upward. 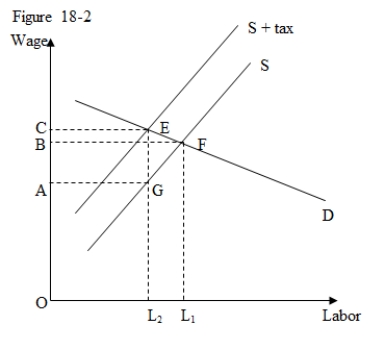 -In Figure 18-2,as a result of a per-unit tax:
(Multiple Choice)
4.8/5  (38)
(38)
Employers sometimes reduce the fringe benefits provided to workers when the government sets a minimum wage in the labor market.Due to this:
(Multiple Choice)
4.7/5 (43)
Which of the following factors determines the extent of the fall in the net-of-tax wage rate after the imposition of a payroll tax?
(Multiple Choice)
4.9/5 (30)
Provide a self-interested explanation for why labor unions spend a lot of time and money lobbying for increases in minimum wage mandates and for legislated "living wage" ordinances even though their members earn far more than the proposed wages.
(Essay)
4.8/5 (35)
Use the following figure to answer the question : Figure 18-3 :
shows the impact of immigration on the labor market of a country.Immigration in shifts the labor supply curve from S to S'. 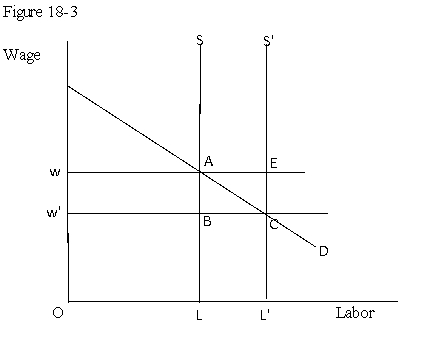 -Refer to Figure 18-3.The total income of the residents of the country increases by the area _____ post immigration.
(Multiple Choice)
4.7/5 (34)
Use the following figure to answer the question : Figure 18-2 :
shows the demand and supply curves of labor.A per-unit tax imposed on the wage income of the employees shifts the supply curve of labor upward.
-According to Figure 18-2,the proportion of the per-unit tax paid by the employers is:
(Multiple Choice)
4.8/5 (36)
What is the long run effect of a pay-as-you-go Social Security program on the gross domestic product [GDP] of a country?
(Essay)
4.9/5 (41)
One adverse effect of the pay-as-you-go system of funding Social Security is that:
(Multiple Choice)
4.9/5 (30)
Use the following figure to answer the question : Figure 18-2 :
shows the demand and supply curves of labor.A per-unit tax imposed on the wage income of the employees shifts the supply curve of labor upward.
-Refer to Figure 18-2.The per-unit tax is this figure is being represented by the distance:
(Multiple Choice)
4.8/5 (30)
Which of the following is a true impact of a Social Security program on the labor market?
(Multiple Choice)
4.9/5 (41)
Use the following figure to answer the question : Figure 18-3 :
shows the impact of immigration on the labor market of a country.Immigration in shifts the labor supply curve from S to S'.
-Refer to Figure 18-3.Post immigration the earnings of the native laborers in the country declines by the area:
(Multiple Choice)
4.9/5 (35)
Use the following figure to answer the question : Figure 18-1 :
shows the demand and supply of unskilled labor that determines the equilibrium wage rate in the labor market.The minimum wage rate at $5.15 is higher than the equilibrium wage rate at $4. 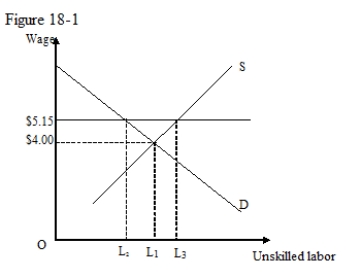 -Refer to Figure 18-1.The increase in the number of workers looking for work in this market due to the imposition of a $5.15 minimum wage is _____.
(Multiple Choice)
5.0/5 (38)
The minimum wage law is not an effective instrument for fighting poverty because:
(Multiple Choice)
4.9/5 (32)
Which of the following facts indicate that the official wage paid by the National Collegiate Athletic Association [NCAA] to the athletes is below the market-clearing level?
(Multiple Choice)
4.7/5 (39)
Which of the following is not a consequence of the minimum wage law?
(Multiple Choice)
4.8/5 (26)
Filters
- Essay(0)
- Multiple Choice(0)
- Short Answer(0)
- True False(0)
- Matching(0)