Exam 2: Descriptive Statistics: Tabular and Graphical Presentations
Exam 1: Data and Statistics104 Questions
Exam 2: Descriptive Statistics: Tabular and Graphical Presentations65 Questions
Exam 3: Descriptive Statistics: Numerical Measures162 Questions
Exam 4: Introduction to Probability146 Questions
Exam 5: Discrete Probability Distributions121 Questions
Exam 6: Continuous Probability Distributions165 Questions
Exam 7: Sampling and Sampling Distributions131 Questions
Exam 8: Interval Estimation131 Questions
Exam 9: Hypothesis Tests136 Questions
Exam 10: Comparisons Involving Means, Experimental Design and Analysis of Variance208 Questions
Exam 11: Comparisons Involving Proportions and a Test of Independence94 Questions
Exam 12: Simple Linear Regression140 Questions
Exam 13: Multiple Regression146 Questions
Select questions type
Exhibit 2-1
The numbers of hours worked (per week) by 400 statistics students are shown below.
 -Refer to Exhibit 2-1. The midpoint of the last class is
Free
(Multiple Choice)
5.0/5  (31)
(31)
Correct Answer: Verified
D
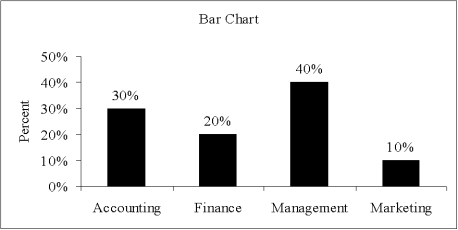
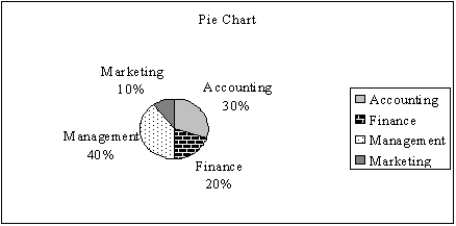
There are 800 students in the School of Business Administration. There are four majors in the School: Accounting, Finance, Management, and Marketing. The following shows the number of students in each major.
 Develop a percent frequency distribution and construct a bar chart and a pie chart.
Free
(Essay)
4.7/5 (31)
Correct Answer:Verified

In constructing a frequency distribution, as the number of classes are decreased, the class width
Free
(Multiple Choice)
5.0/5 (38)
Correct Answer:Verified
C
Exhibit 2-3
Michael's Compute-All, a national computer retailer, has kept a record of the number of laptop computers they have sold for a period of 80 days. Their sales records are shown below:
Number of Laptops Sold Number of Days
0 - 19 5
20 - 39 15
40 - 59 30
60 - 79 20
80 - 99 10
Total 80
-Refer to Exhibit 2-3. The class width of the above distribution is
(Multiple Choice)
4.9/5 (34)
For the following observations, plot a scatter diagram and indicate what kind of relationship (if any) exist between x and y.

(Essay)
4.9/5 (37)
Exhibit 2-2
A survey of 800 college seniors resulted in the following crosstabulation regarding their undergraduate major and whether or not they plan to go to graduate school.
 -Refer to Exhibit 2-2. What percentage of the students does not plan to go to graduate school?
(Multiple Choice)
4.8/5 (42)
A student has completed 20 courses in the School of Arts and Sciences. Her grades in the 20 courses are shown below.
 a.Develop a frequency distribution and a bar chart for her grades.
b.Develop a relative frequency distribution for her grades and construct a pie chart.
a.Develop a frequency distribution and a bar chart for her grades.
b.Develop a relative frequency distribution for her grades and construct a pie chart.
(Essay)
4.8/5 (27)
A sample of the ages of 10 employees of a company is shown below.
 Construct a dot plot for the above data.
(Essay)
4.7/5 (34)
Five hundred recent graduates indicated their majors as follows.
 a.Construct a relative frequency distribution.
b.Construct a percent frequency distribution.
a.Construct a relative frequency distribution.
b.Construct a percent frequency distribution.
(Essay)
4.8/5 (34)
The sum of the percent frequencies for all classes will always equal
(Multiple Choice)
4.9/5 (31)
Exhibit 2-1
The numbers of hours worked (per week) by 400 statistics students are shown below.
-Refer to Exhibit 2-1. The percentage of students working 19 hours or less is
(Multiple Choice)
4.8/5 (31)
The difference between the lower class limits of adjacent classes provides the
(Multiple Choice)
4.9/5 (36)
A frequency distribution is a tabular summary of data showing the
(Multiple Choice)
4.8/5 (30)
The test scores of 14 individuals on their first statistics examination are shown below.
 Construct a stem-and-leaf display for these data.
(Essay)
4.8/5 (42)
In a cumulative relative frequency distribution, the last class will have a cumulative relative frequency equal to
(Multiple Choice)
4.8/5 (32)
The SAT scores of a sample of business school students and their genders are shown below.
 a.How many students scored less than 20?
b.How many students were female?
c.Of the male students, how many scored 25 or more?
d.Compute row percentages and comment on any relationship that may exist between SAT scores and gender of the individuals.
e.
Compute column percentages.
a.How many students scored less than 20?
b.How many students were female?
c.Of the male students, how many scored 25 or more?
d.Compute row percentages and comment on any relationship that may exist between SAT scores and gender of the individuals.
e.
Compute column percentages.
(Essay)
4.9/5 (30)
Exhibit 2-1
The numbers of hours worked (per week) by 400 statistics students are shown below.
-Refer to Exhibit 2-1. The cumulative percent frequency for the class of 30 - 39 is
(Multiple Choice)
4.8/5 (37)
Filters
- Essay(0)
- Multiple Choice(0)
- Short Answer(0)
- True False(0)
- Matching(0)