Exam 3: Interdependence and the Gains From Trade
Exam 1: Ten Principles of Economics216 Questions
Exam 2: Thinking Like an Economist234 Questions
Exam 3: Interdependence and the Gains From Trade206 Questions
Exam 4: The Market Forces of Supply and Demand349 Questions
Exam 5: Measuring a Nations Income169 Questions
Exam 6: Measuring the Cost of Living181 Questions
Exam 7: Production and Growth191 Questions
Exam 8: Saving, investment, and the Financial System213 Questions
Exam 9: Unemployment and Its Natural Rate197 Questions
Exam 10: The Monetary System204 Questions
Exam 11: Money Growth and Inflation195 Questions
Exam 12: Open-Economy Macroeconomics: Basic Concepts220 Questions
Exam 13: A Macroeconomic Theory of the Small Open Economy196 Questions
Exam 14: Aggregate Demand and Aggregate Supply257 Questions
Exam 15: The Influence of Monetary and Fiscal Policy on Aggregate Demand222 Questions
Exam 16: The Short-Run Tradeoff Between Inflation and Unemployment207 Questions
Exam 17: Five Debates Over Macroeconomic Policy119 Questions
Select questions type
Table 3-4 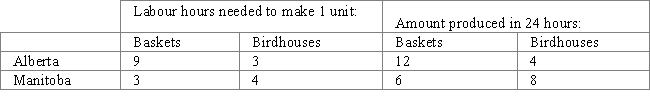
-Refer to the table.What is the opportunity cost of one basket for Alberta?
-Refer to the table.What is the opportunity cost of one basket for Alberta?
(Multiple Choice)
4.8/5  (43)
(43)
Table 3-5 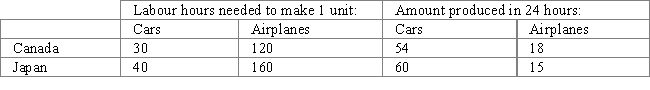
-Refer to Table 3-5.If Japan and Canada open up trade based on the principle of comparative advantage,who loses in the short term in Canada?
-Refer to Table 3-5.If Japan and Canada open up trade based on the principle of comparative advantage,who loses in the short term in Canada?
(Multiple Choice)
4.9/5 (41)
Two countries can achieve gains from trade even if one country has an absolute advantage in the production of both goods.
(True/False)
4.7/5 (32)
South Korea can produce shoes,clothes,TV sets,and computers cheaper than any other country.What would one expect South Korea to export?
(Multiple Choice)
4.7/5 (35)
Table 3-2 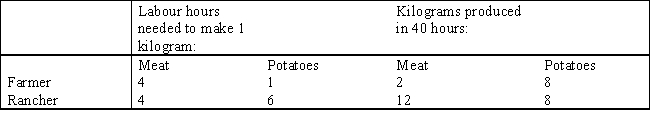
-Refer to Table 3-2.What is the opportunity cost of 1 kilogram of potatoes for the farmer?
-Refer to Table 3-2.What is the opportunity cost of 1 kilogram of potatoes for the farmer?
(Multiple Choice)
4.8/5 (33)
Table 3-5
-Refer to Table 3-5.If Canada and Japan trade based on the principle of comparative advantage,what could Canada gain from importing a car?
(Multiple Choice)
5.0/5 (36)
Figure 3-5
These graphs illustrate the production possibilities available for dancing shoes to Fred and Ginger with 40 hours of labour. 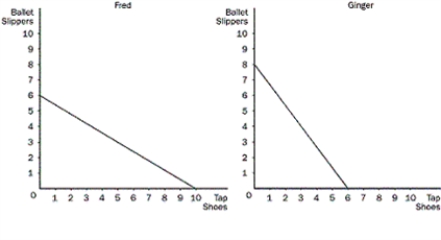 -Refer to Figure 3-5.Who has a comparative advantage in each good?
(Multiple Choice)
4.9/5 (36)
Explain the difference between absolute advantage and comparative advantage.Which is more important in determining trade patterns and why?
(Essay)
4.8/5 (32)
Figure 3-3
Ice cream and cones are measured in kilograms. 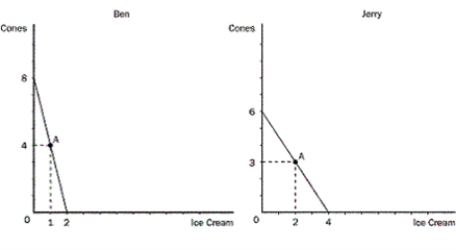 -Refer to Figure 3-3.For Ben,what is the opportunity cost of 1 kg of cones?
(Multiple Choice)
4.7/5 (35)
Mike and Sandy are two woodworkers who both make tables and chairs.In one month,Mike can make 6tables or 18 chairs,where Sandy can make 5 tables or 25 chairs.What is the opportunity cost of 1 table?
(Multiple Choice)
4.7/5 (33)
Table 3-6 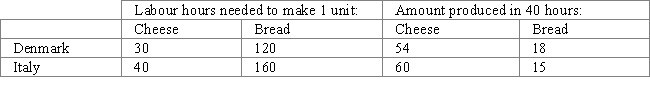
-Refer to Table 3-5.Which country has an absolute or comparative advantage in each product?
-Refer to Table 3-5.Which country has an absolute or comparative advantage in each product?
(Multiple Choice)
4.9/5 (33)
It takes Barbara 3 hours to make a pie and 4 hours to make a shirt.It takes Gary 2 hours to make a pie and 5 hours to make a shirt.Barbara should specialize in making shirts and Gary should specialize in making pies,then they should trade.
(True/False)
4.7/5 (28)
The producer who has the smaller opportunity cost of producing a good is said to have an absolute advantage in producing that good.
(True/False)
4.8/5 (28)
Figure 3-4 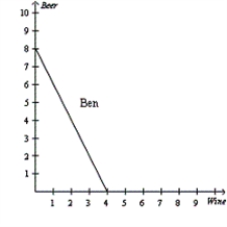
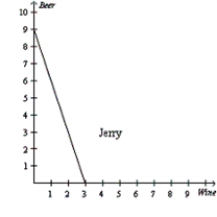 -Refer to Figure 3-4.Suppose Ben and Jerry both spend half their time producing beer and half their time producing wine.How much wine and beer does each produce?
(Multiple Choice)
4.9/5 (31)
Mike and Sandy are two woodworkers who both make tables and chairs.In one month,Mike can make 6 tables or 18 chairs,where Sandy can make 5 tables or 25 chairs.Who has an absolute advantage in which product?
(Multiple Choice)
4.7/5 (42)
Refer to Table 3-5.If Canada and Japan trade based on the principle of comparative advantage,at what price would the two countries trade?
(Multiple Choice)
4.7/5 (29)
Figure 3-5
These graphs illustrate the production possibilities available for dancing shoes to Fred and Ginger with 40 hours of labour.
-Refer to Figure 3-5.What should Ginger and Fred specialize in?
(Multiple Choice)
4.9/5 (20)
The "two-country,two-good" model (sometimes called the 2×2 model)of comparative advantage that we have studied so far is simple,insightful,and compelling.However,its very simplicity turns out to be its weakness.In the real world,when many countries produce many goods,the simple 2×2 model is of limited use in predicting patterns of trade.To see how complex such a model can become,let us consider a 2×3 model (two countries,1 and 2,and three goods,A,B,and C.)The following table gives the maximum amounts (units)of each good that each country can produce if all the country's resources were used in the production of the respective good.In other words,the table describes each country's production possibilities frontier.  a.How do the production possibilities frontiers for each of the two countries look in a three-dimensional coordinate system? (Draw three axes like a corner in your room,and label them after the three goods: A,B,and C.Then,place the number of units for each good for Country 1on its respective axis and connect the three intercepts by straight lines.Repeat for Country 2 on a separate graph.)
b.Calculate the opportunity costs of good A in terms of B and C in each country and call these prices PA1 and PA2 respectively.
c.Calculate the opportunity costs of good B in terms of A and C in each country and call these prices PB1 and PB2 respectively.
d.Calculate the opportunity costs of good C in terms of A and B in each country and call these prices PC1 and PC2 respectively.
e.Based on your calculations,can you tell which country should export or import each product based on comparative advantage?
a.How do the production possibilities frontiers for each of the two countries look in a three-dimensional coordinate system? (Draw three axes like a corner in your room,and label them after the three goods: A,B,and C.Then,place the number of units for each good for Country 1on its respective axis and connect the three intercepts by straight lines.Repeat for Country 2 on a separate graph.)
b.Calculate the opportunity costs of good A in terms of B and C in each country and call these prices PA1 and PA2 respectively.
c.Calculate the opportunity costs of good B in terms of A and C in each country and call these prices PB1 and PB2 respectively.
d.Calculate the opportunity costs of good C in terms of A and B in each country and call these prices PC1 and PC2 respectively.
e.Based on your calculations,can you tell which country should export or import each product based on comparative advantage?
(Essay)
4.7/5 (32)
Table 3-6
-Refer to Table 3-5.Denmark and Italy trade according to the principle of comparative advantage.If the international price of bread is 2.5 units of cheese for 1 unit of bread,what is the gain from trade to Denmark per unit of bread traded?
(Multiple Choice)
4.9/5 (31)
Filters
- Essay(0)
- Multiple Choice(0)
- Short Answer(0)
- True False(0)
- Matching(0)