Exam 12: Simple Regression Analysis and Correlation
Exam 1: Introduction to Statistics79 Questions
Exam 2: Charts and Graphs75 Questions
Exam 3: Descriptive Statistics63 Questions
Exam 4: Probability72 Questions
Exam 5: Discrete Distributions80 Questions
Exam 6: Continuous Distributions78 Questions
Exam 7: Sampling and Sampling Distributions76 Questions
Exam 8: Statistical Inference: Estimation for Single Populations80 Questions
Exam 9: Statistical Inference: Hypothesis Testing for Single Populations79 Questions
Exam 10: Statistical Inferences About Two Populations70 Questions
Exam 11: Analysis of Variance and Design of Experiments80 Questions
Exam 12: Simple Regression Analysis and Correlation84 Questions
Exam 13: Multiple Regression Analysis80 Questions
Exam 14: Building Multiple Regression Models80 Questions
Exam 15: Time-Series Forecasting and Index Numbers77 Questions
Exam 16: Analysis of Categorical Data76 Questions
Exam 17: Nonparametric Statistics81 Questions
Exam 18: Statistical Quality Control68 Questions
Exam 19: Decision Analysis78 Questions
Select questions type
Abby Kratz,a market specialist at the market research firm of Saez,Sikes,and Spitz,is analyzing household budget data collected by her firm.Abby's dependent variable is monthly household expenditures on groceries (in $'s),and her independent variable is annual household income (in $1,000's).Regression analysis of the data yielded the following tables:  11ea888b_415f_cb5d_bb89_3f3309f7ca00_TB1680_00 Abby's regression model is ___.s),and her independent variable is annual household income (in $1,000's).Regression analysis of the data yielded the following tables: Abby's regression model is ___." class="answers-bank-image d-inline" loading="lazy" > Abby's regression model is ___.s),and her independent variable is annual household income (in $1,000's).Regression analysis of the data yielded the following tables: Abby's regression model is ___." class="answers-bank-image d-inline" loading="lazy" > 11ea888b_415f_cb5d_bb89_3f3309f7ca00_TB1680_00 Abby's regression model is ___.
Free
(Multiple Choice)
4.8/5  (34)
(34)
Correct Answer: Verified
E
In the regression equation,y = 75.65 + 0.50x,the intercept is ___.
Free
(Multiple Choice)
4.8/5 (26)
Correct Answer:Verified
B
Alan Bissell,market analyst for City Sound Mart,is analyzing the relation between heavy metal CD sales and the size of the teenage population.He gathers data from six sales districts.Alan's dependent variable is annual heavy metal CD sales (in $1,000,000's),and his independent variable is teenage population (in 1,000's).Regression analysis of the data yielded the following tables. 
 The numerical value of the correlation coefficient between the CD sales and the size of teenage population is ___.
Free
(Multiple Choice)
4.8/5 (44)
Correct Answer:Verified
A
One of the major uses of residual analysis is to test some of the assumptions underlying regression.
(True/False)
4.8/5 (28)
A cost accountant is developing a regression model to predict the total cost of producing a batch of printed circuit boards as a linear function of batch size (the number of boards produced in one lot or batch).The slope of the accountant's model is ___.
(Multiple Choice)
4.8/5 (28)
In simple regression analysis the error terms are assumed to be independent and normally distributed with zero mean and constant variance.
(True/False)
4.9/5 (29)
The coefficient of correlation in a simple regression analysis is = - 0.6.The coefficient of determination for this regression would be ___.
(Multiple Choice)
4.9/5 (42)
One of the assumptions made in simple regression is that ___.
(Multiple Choice)
4.8/5 (41)
A researcher has developed a regression model from fourteen pairs of data points.He wants to test to determine if the slope is significantly different from zero.He uses a two-tailed test and = 0.01.The critical table t value is ___.
(Multiple Choice)
4.9/5 (31)
A researcher has developed a regression model from fifteen pairs of data points.He wants to test to determine if the slope is significantly different from zero.He uses a two-tailed test and = 0.10.The critical table t value is ___.
(Multiple Choice)
4.9/5 (36)
Use the t and F tests to test hypotheses for both the slope of the regression model and the overall regression model.
(Essay)
4.8/5 (32)
A manager wishes to predict the annual cost (y)of an automobile based on the number of kilometres (x)driven.The following model was developed: y = 1,550 + 0.36x.If a car is driven 15,000 kilometres,the predicted cost is ___.
(Multiple Choice)
4.8/5 (26)
For following scatter plot and regression line,at x = 65 the residual is ___. 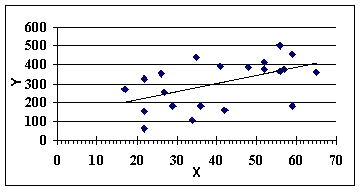
(Multiple Choice)
4.7/5 (32)
The first step in simple regression analysis usually is to construct a scatter plot.
(True/False)
4.8/5 (34)
A t test is used to determine whether the coefficients of the regression model are significantly different from zero.
(True/False)
4.8/5 (41)
The range of admissible values for the coefficient determination is −1 to +1.
(True/False)
4.9/5 (46)
Louis Katz,a cost accountant at Papalote Plastics,Inc.(PPI),is analyzing the manufacturing costs of a moulded plastic telephone handset produced by PPI.Louis's independent variable is production lot size (in 1,000's of units),and his dependent variable is the total cost of the lot (in $100's).Regression analysis of the data yielded the following tables: 
 The correlation coefficient between Louis's variables is ___.
(Multiple Choice)
4.8/5 (35)
Calculate the coefficient of determination to measure the fit for regression models,and relate it to the coefficient of correlation.
(Essay)
4.9/5 (36)
The numerical value of the coefficient of correlation must be ___.
(Multiple Choice)
4.8/5 (40)
Filters
- Essay(0)
- Multiple Choice(0)
- Short Answer(0)
- True False(0)
- Matching(0)