Exam 12: Simple Regression Analysis and Correlation
Exam 1: Introduction to Statistics79 Questions
Exam 2: Charts and Graphs75 Questions
Exam 3: Descriptive Statistics63 Questions
Exam 4: Probability72 Questions
Exam 5: Discrete Distributions80 Questions
Exam 6: Continuous Distributions78 Questions
Exam 7: Sampling and Sampling Distributions76 Questions
Exam 8: Statistical Inference: Estimation for Single Populations80 Questions
Exam 9: Statistical Inference: Hypothesis Testing for Single Populations79 Questions
Exam 10: Statistical Inferences About Two Populations70 Questions
Exam 11: Analysis of Variance and Design of Experiments80 Questions
Exam 12: Simple Regression Analysis and Correlation84 Questions
Exam 13: Multiple Regression Analysis80 Questions
Exam 14: Building Multiple Regression Models80 Questions
Exam 15: Time-Series Forecasting and Index Numbers77 Questions
Exam 16: Analysis of Categorical Data76 Questions
Exam 17: Nonparametric Statistics81 Questions
Exam 18: Statistical Quality Control68 Questions
Exam 19: Decision Analysis78 Questions
Select questions type
If there is perfect negative correlation between two sets of numbers,then ___.
(Multiple Choice)
4.8/5  (34)
(34)
Calculate the Pearson product-moment correlation coefficient to determine if there is a correlation between two variables.
(Essay)
4.8/5 (38)
In the simple regression model,y = 21 − 5x,if the coefficient of determination is 0.81,we can say that the coefficient of correlation between y and x is 0.90.
(True/False)
4.8/5 (44)
Louis Katz,a cost accountant at Papalote Plastics,Inc.(PPI),is analyzing the manufacturing costs of a moulded plastic telephone handset produced by PPI.Louis's independent variable is production lot size (in 1,000's of units),and his dependent variable is the total cost of the lot (in $100's).Regression analysis of the data yielded the following tables: 
 Louis's regression model is ___.
(Multiple Choice)
4.7/5 (30)
Louis Katz,a cost accountant at Papalote Plastics,Inc.(PPI),is analyzing the manufacturing costs of a moulded plastic telephone handset produced by PPI.Louis's independent variable is production lot size (in 1,000's of units),and his dependent variable is the total cost of the lot (in $100's).Regression analysis of the data yielded the following tables: 
 Using = 0.05,Louis should ___.
(Multiple Choice)
4.8/5 (34)
For the regression line,y = 21 − 5x,21 is the y intercept of the line.
(True/False)
4.8/5 (28)
Louis Katz,a cost accountant at Papalote Plastics,Inc.(PPI),is analyzing the manufacturing costs of a moulded plastic telephone handset produced by PPI.Louis's independent variable is production lot size (in 1,000's of units),and his dependent variable is the total cost of the lot (in $100's).Regression analysis of the data yielded the following tables: 
 Louis's sample size (n)is ___.
(Multiple Choice)
4.9/5 (21)
From the following scatter plot,we can say that between y and x there is ___. 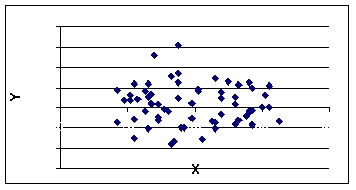
(Multiple Choice)
4.9/5 (39)
In the regression equation,y = 75.65 + 0.50x,the slope is ___.
(Multiple Choice)
4.8/5 (31)
One of the assumptions of simple regression analysis is that the error terms are exponentially distributed.
(True/False)
4.8/5 (32)
Explain what regression analysis is and the concepts of independent and dependent variable.
(Essay)
4.9/5 (32)
A cost accountant is developing a regression model to predict the total cost of producing a batch of printed circuit boards as a linear function of batch size (the number of boards produced in one lot or batch).The intercept of this model is the ___.
(Multiple Choice)
4.8/5 (33)
A manager wants to predict the cost (y)of travel for salespeople based on the number of days (x)spent on each sales trip.The following model has been developed: y = $400 + 120x.If a trip took 4 days,the predicted cost of the trip is ___.
(Multiple Choice)
4.8/5 (39)
The F value to test the overall significance of a regression model is computed by dividing the sum of squares regression (SSreg)by the sum of squares error (SSerr).
(True/False)
4.8/5 (41)
A cost accountant is developing a regression model to predict the total cost of producing a batch of printed circuit boards as a function of batch size (the number of boards produced in one lot or batch).The dependent variable is ___.
(Multiple Choice)
4.8/5 (41)
A cost accountant is developing a regression model to predict the total cost of producing a batch of printed circuit boards as a function of batch size (the number of boards produced in one lot or batch).The explanatory variable is ___.
(Multiple Choice)
4.7/5 (47)
The following data is to be used to construct a regression model:  The value of the slope is ___.
(Multiple Choice)
4.8/5 (26)
Consider the following scatter plot and regression line.At x = 17,the residual (error term)is ___. 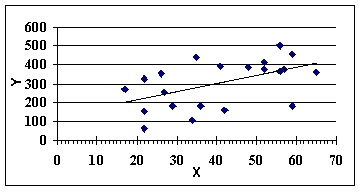
(Multiple Choice)
4.7/5 (28)
To determine whether the overall regression model is significant,the F test is used.
(True/False)
4.7/5 (23)
Filters
- Essay(0)
- Multiple Choice(0)
- Short Answer(0)
- True False(0)
- Matching(0)