Exam 16: The Distribution of Income and Social Policy
Exam 1: Economics: Foundations and Models160 Questions
Exam 2: Choices and Trade-Offs in the Market192 Questions
Exam 3: Where Prices Come From: the Interaction of Demand and Supply202 Questions
Exam 4: Elasticity: the Responsiveness of Demand and Supply226 Questions
Exam 5: Economic Efficiency, Government Price Setting and Taxes187 Questions
Exam 6: Consumer Choice and Behavioural Economics254 Questions
Exam 7: Technology, Production and Costs300 Questions
Exam 8: Firms in Perfectly Competitive Markets270 Questions
Exam 9: Monopoly Markets281 Questions
Exam 10: Monopolistic Competition253 Questions
Exam 11: Oligopoly: Firms in Less Competitive Markets186 Questions
Exam 12: The Markets for Labour and Other Factors of Production253 Questions
Exam 13: International Trade131 Questions
Exam 14: Government Intervention in the Market122 Questions
Exam 15: Externalities, Environmental Policy and Public Goods212 Questions
Exam 16: The Distribution of Income and Social Policy121 Questions
Select questions type
A proportional tax is a tax for which people with lower incomes
(Multiple Choice)
4.9/5  (34)
(34)
Policymakers focus on marginal tax rate changes when making changes in the tax code because the marginal tax rate
(Multiple Choice)
4.9/5 (34)
A Lorenz curve summarises the information provided by a Gini coefficient.
(True/False)
4.8/5 (35)
If grocery stores were legally required to charge a 10-cent fee for disposable grocery bags,who would bear the largest burden of this fee?
(Essay)
4.8/5 (33)
Horizontal equity is achieved when taxes are collected from those who benefit from the government expenditure of the tax revenue.
(True/False)
4.9/5 (31)
If the government wants to minimise the welfare loss of a tax,it should tax goods with more inelastic demands or supplies.
(True/False)
4.8/5 (41)
Figure 16-1 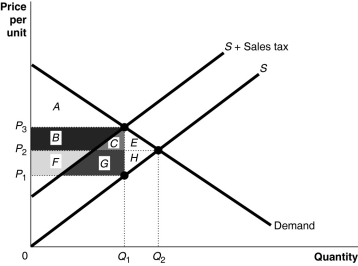 -Refer to Figure 16-1.Of the tax revenue collected by the government,the portion borne by consumers is represented by the area
(Multiple Choice)
4.9/5 (29)
Figure 16-1
-Refer to Figure 16-1.Area B + C + F + G represents
(Multiple Choice)
4.9/5 (32)
Figure 16-1
-Refer to Figure 16-1.The excess burden of the tax is represented by the area
(Multiple Choice)
4.8/5 (33)
'Sin taxes,' such as taxes on alcoholic beverages,are intended to
(Multiple Choice)
4.7/5 (30)
For a given supply curve,the deadweight loss from the imposition of a tax is smaller if demand is more elastic.
(True/False)
4.8/5 (35)
Figure 16-2 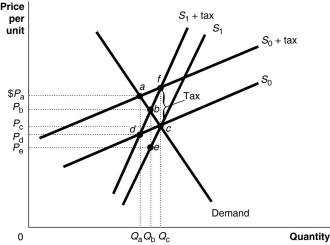 Figure 16-2 shows a demand curve and two sets of supply curves,one set more elastic than the other.
-Refer to Figure 16-2.If the government imposes an excise tax of $1.00 on every unit sold,the government's revenue from the tax
Figure 16-2 shows a demand curve and two sets of supply curves,one set more elastic than the other.
-Refer to Figure 16-2.If the government imposes an excise tax of $1.00 on every unit sold,the government's revenue from the tax
(Multiple Choice)
4.8/5 (33)
Filters
- Essay(0)
- Multiple Choice(0)
- Short Answer(0)
- True False(0)
- Matching(0)