Exam 9: An Introduction to the Short Run
Exam 1: Introduction to Macroeconomics34 Questions
Exam 2: Measuring the Macroeconomy98 Questions
Exam 3: An Overview of Long- Run Economic Growth102 Questions
Exam 4: A Model of Production113 Questions
Exam 5: The Solow Growth Model116 Questions
Exam 6: Growth and Ideas102 Questions
Exam 7: The Labor Market,wages,and Unemployment100 Questions
Exam 8: Inflation99 Questions
Exam 9: An Introduction to the Short Run96 Questions
Exam 10: The Great Recession: a First Look95 Questions
Exam 11: The Is Curve101 Questions
Exam 12: Monetary Policy and the Phillips Curve100 Questions
Exam 13: Stabilization Policy and the Asad Framework97 Questions
Exam 14: The Great Recession and the Short-Run Model99 Questions
Exam 15: Consumption98 Questions
Exam 16: Investment101 Questions
Exam 17: The Government and the Macroeconomy96 Questions
Exam 18: International Trade96 Questions
Exam 19: Exchange Rates and International Finance109 Questions
Exam 20: Parting Thoughts31 Questions
Select questions type
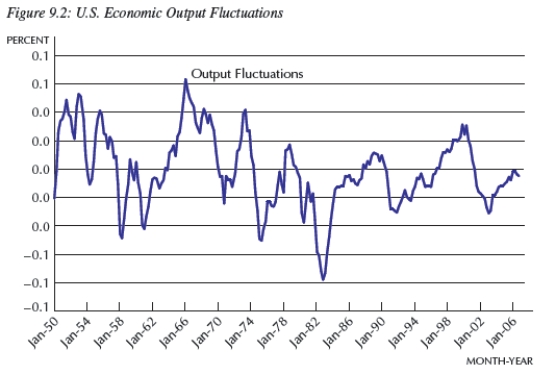 -Consider Figure 9.2.The line represents short-run fluctuations,
  )Since 1950,the largest boom was in about __________ and the deepest recession was in about __________.
(Multiple Choice)
4.7/5  (37)
(37)
Suppose an economy's natural rate of unemployment is 5 percent.If the unemployment rate is 3 percent,according to Okun's law,  Is:
Is:
(Multiple Choice)
4.8/5 (36)
You are a staff economist with the Federal Reserve.The chairman says to you,"The rate of change in inflation is too high,and I don't think the Phillips curve is very steep.What should we do to reduce these inflationary increases?" You respond with,
(Multiple Choice)
4.8/5 (43)
Suppose an economy exhibits a large unexpected increase in productivity growth that lasts for a decade.However,monetary policymakers are slow to recognize that the change is to potential,not current,output,and interpret the increase in output as a boom that leads current to exceed potential output.In this scenario,policymakers believe that __________ pressures are building and incorrectly respond by __________ interest rates,sending the economy into a(n)__________ gap.
(Multiple Choice)
4.8/5 (35)
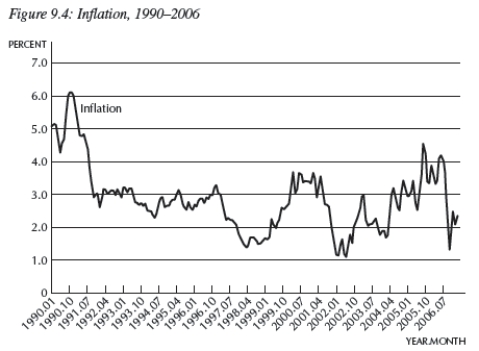 -Consider Figure 9.4,which shows the annual inflation rate month to month.According to the Phillips curve,the period from about 2001.01 to 2001.12 is a period of ___________.
(Multiple Choice)
4.9/5 (35)
-Consider two economies.Economy 1 has a steep Phillips curve and Economy 2 has a gently sloped Phillips curve.If each economy experiences an identical economic expansion,__________ would increase less in __________ and would experience a relatively __________ change in output.
(Multiple Choice)
4.8/5 (38)
Which of the following is not an example of a short term macroeconomic "shock"?
(Multiple Choice)
4.7/5 (29)
The Board of Governors of the Federal Reserve is responsible for dating business cycles.
(True/False)
4.9/5 (37)
-Consider Figure 9.2.In 1989,the U.S.economy experienced a(n)economic __________,and current output was about __________ potential output.
(Multiple Choice)
4.8/5 (40)
John Maynard Keynes is famous for saying,"In the long run __________."
(Multiple Choice)
4.9/5 (32)
Suppose an economy's natural rate of unemployment is 5 percent.If the unemployment rate is 7 percent,according to Okun's law,  Is:
Is:
(Multiple Choice)
4.8/5 (35)
-Consider Figure 9.2,which represents  t.In approximately what years did the U.S.economy experience its longest economic expansion?
(Multiple Choice)
4.8/5 (36)
According to the text,which of the following can be used to estimate potential output?
i.Get the data from the Census Bureau.
ii.Survey leading economists.
iii.Gather current data from statistical agencies,such as the Bureau of Economic Analysis.
(Multiple Choice)
4.8/5 (34)
Which of the following is not an example of a short term macroeconomic "shock"?
(Multiple Choice)
4.8/5 (39)
-Consider Figure 9.4,which shows the annual inflation rate month to month.According to the Phillips curve,the period from about 1998.04 to 2000.02 is a period of ___________.
(Multiple Choice)
4.9/5 (36)
According to Okun's law,if the Federal Reserve wants to reduce unemployment,it should __________ interest rates,which would __________ output.
(Multiple Choice)
4.9/5 (34)
Filters
- Essay(0)
- Multiple Choice(0)
- Short Answer(0)
- True False(0)
- Matching(0)