Exam 9: An Introduction to the Short Run
Exam 1: Introduction to Macroeconomics34 Questions
Exam 2: Measuring the Macroeconomy98 Questions
Exam 3: An Overview of Long- Run Economic Growth102 Questions
Exam 4: A Model of Production113 Questions
Exam 5: The Solow Growth Model116 Questions
Exam 6: Growth and Ideas102 Questions
Exam 7: The Labor Market,wages,and Unemployment100 Questions
Exam 8: Inflation99 Questions
Exam 9: An Introduction to the Short Run96 Questions
Exam 10: The Great Recession: a First Look95 Questions
Exam 11: The Is Curve101 Questions
Exam 12: Monetary Policy and the Phillips Curve100 Questions
Exam 13: Stabilization Policy and the Asad Framework97 Questions
Exam 14: The Great Recession and the Short-Run Model99 Questions
Exam 15: Consumption98 Questions
Exam 16: Investment101 Questions
Exam 17: The Government and the Macroeconomy96 Questions
Exam 18: International Trade96 Questions
Exam 19: Exchange Rates and International Finance109 Questions
Exam 20: Parting Thoughts31 Questions
Select questions type
Which of the following is not an example of a short term macroeconomic "shock"?
(Multiple Choice)
4.8/5  (29)
(29)
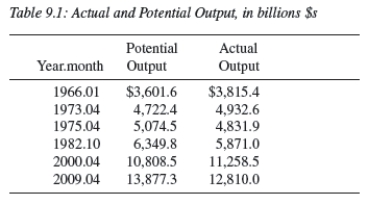 -The table below displays the United States' potential and actual output for six select months between 1960 and 2009.In which month does the economy have the largest expansionary gap? Largest recessionary gap?
Table 9.1: Actual and Potential Output,in billions $s
-The table below displays the United States' potential and actual output for six select months between 1960 and 2009.In which month does the economy have the largest expansionary gap? Largest recessionary gap?
Table 9.1: Actual and Potential Output,in billions $s
(Essay)
4.9/5 (36)
The Phillips curve shows the negative relationship between output fluctuations and the change in inflation.
(True/False)
4.8/5 (31)
The relationship between actual output in an economy,the long-run component,and the short-run component is given as: Long-run trend = Current output + Shortrun fluctuations.
(True/False)
4.8/5 (37)
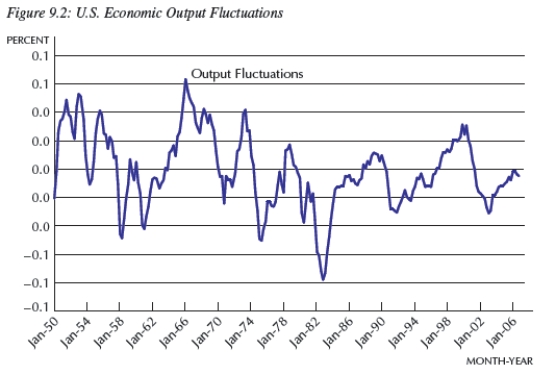 -Consider Figure 9.2,which represents
  t.In approximately what years did the U.S.economy experience its longest economic downturn,using the text's definition?
(Multiple Choice)
4.7/5 (39)
Generally speaking,the rate of inflation rises during a recession.
(True/False)
4.9/5 (40)
A decline in long-term productivity implies that an economy requires more resources to produce goods;therefore,as costs of production rise,we should see an acceleration in inflation.
(True/False)
4.8/5 (36)
In 1980,the inflation rate reached about 14 percent,due in part to ___________.The Board of Governors of the Federal Reserve under __________ decided to __________ interest rates,sending the economy into a __________.
(Multiple Choice)
4.8/5 (37)
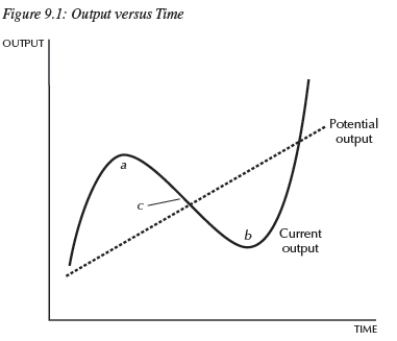 -Consider Figure 9.1.The dashed line is potential output and the solid line is current output;therefore,
(Multiple Choice)
4.9/5 (37)
Defining  As current output,
  As potential output,and
  As short-run fluctuations,which of the following equations is correct?
(Multiple Choice)
4.8/5 (30)
According to the Phillips curve presented in the text,a positive macroeconomic shock decreases the rate of inflation.
(True/False)
4.9/5 (33)
Suppose an economy exhibits a large unexpected decrease in productivity growth that lasts for a decade.However,monetary policymakers are slow to recognize that the change is to potential,not current,output,and interpret the decrease in output as a recession that leads current to fall below potential output.In this scenario,policymakers believe that __________ pressures are building and incorrectly respond by __________ interest rates,sending the economy into a(n)___________ gap.
(Multiple Choice)
4.9/5 (33)
The Phillips curve in the text shows the __________ relationship between __________ and __________.
(Multiple Choice)
4.7/5 (36)
If  ,the macroeconomy is producing at its potential level of output.
(True/False)
5.0/5 (33)
Filters
- Essay(0)
- Multiple Choice(0)
- Short Answer(0)
- True False(0)
- Matching(0)