Exam 12: Simple Regression Analysis and Correlation
Exam 1: Introduction to Statistics94 Questions
Exam 2: Charts and Graphs92 Questions
Exam 3: Descriptive Statistics81 Questions
Exam 4: Probability87 Questions
Exam 5: Discrete Distributions88 Questions
Exam 6: Continuous Distributions90 Questions
Exam 7: Sampling and Sampling Distributions93 Questions
Exam 8: Statistical Inference: Estimation for Single Populations88 Questions
Exam 9: Statistical Inference: Hypothesis Testing for Single Populations101 Questions
Exam 10: Statistical Inferences About Two Populations98 Questions
Exam 11: A Nalysis of Variance and Design of Experiments106 Questions
Exam 12: Simple Regression Analysis and Correlation106 Questions
Exam 13: Multiple Regression Analysis93 Questions
Exam 14: Building Multiple Regression Models95 Questions
Exam 15: Time-Series Forecasting and Index Numbers94 Questions
Exam 16: Analysis of Categorical Data85 Questions
Exam 17: Nonparametric Statistics99 Questions
Exam 18: Statistical Quality Control86 Questions
Exam 19: Decision Analysis91 Questions
Select questions type
Prediction intervals get narrower as we extrapolate outside the range of the data.
(True/False)
4.9/5  (34)
(34)
One of the major uses of residual analysis is to test some of the assumptions underlying regression.
(True/False)
4.9/5 (40)
The following data is to be used to construct a regression model:  The value of the slope is ____________.
(Multiple Choice)
4.9/5 (36)
One of the assumptions made in simple regression is that ______________.
(Multiple Choice)
4.8/5 (34)
If there is positive correlation between two sets of numbers,then _______.
(Multiple Choice)
5.0/5 (35)
A simple regression model developed for ten pairs of data resulted in a sum of squares of error,SSE = 125.The standard error of the estimate is _______.
(Multiple Choice)
4.8/5 (28)
Which of the following assertions is true about the regression line?
(Multiple Choice)
4.8/5 (35)
Louis Katz,a cost accountant at Papalote Plastics,Inc.(PPI),is analyzing the manufacturing costs of a molded plastic telephone handset produced by PPI.Louis's independent variable is production lot size (in 1,000's of units),and his dependent variable is the total cost of the lot (in $100's).Regression analysis of the data yielded the following tables. 
 The correlation coefficient between Louis's variables is ________________.
(Multiple Choice)
4.7/5 (43)
From the following scatter plot,we can say that between y and x there is _______. 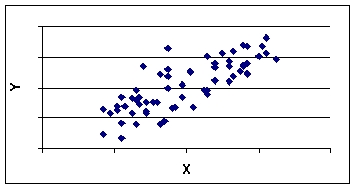
(Multiple Choice)
4.7/5 (40)
Annie Mikhail,market analyst for a national company specializing in historic city tours,is analyzing the relationship between the sales revenue from historic city tours and the size of the city.She gathers data from six cities in which the tours are offered.Annie's dependent variable is annual sales revenues and her independent variable is the city population.Regression analysis of the data yielded the following tables. 
 The numerical value of the correlation coefficient between the historic city tour sales and the size of city population is __________.
(Multiple Choice)
4.9/5 (34)
A quality manager is developing a regression model to predict the total number of defects as a function of the day of week the item is produced.Production runs are done 10 hours a day,7 days a week. The explanatory variable is ______.
(Multiple Choice)
4.9/5 (41)
Data points that lie apart from the rest of the points are called deviants..
(True/False)
4.8/5 (37)
Louis Katz,a cost accountant at Papalote Plastics,Inc.(PPI),is analyzing the manufacturing costs of a molded plastic telephone handset produced by PPI.Louis's independent variable is production lot size (in 1,000's of units),and his dependent variable is the total cost of the lot (in $100's).Regression analysis of the data yielded the following tables. 
 Using = 0.05,Louis should ________________.
(Multiple Choice)
4.7/5 (35)
The proportion of variability of the dependent variable (y)accounted for or explained by the independent variable (x)is called the coefficient of correlation.
(True/False)
4.9/5 (40)
A simple regression model developed for 12 pairs of data resulted in a sum of squares of error,SSE = 246.The standard error of the estimate is _______.
(Multiple Choice)
4.9/5 (23)
A researcher has developed a regression model from fourteen pairs of data points.He wants to test if the slope is significantly different from zero.He uses a two? tailed test and = 0.01.The critical table t value is _______.
(Multiple Choice)
4.8/5 (30)
The following data is to be used to construct a regression model:  The regression equation is _______________.
(Multiple Choice)
4.8/5 (33)
Filters
- Essay(0)
- Multiple Choice(0)
- Short Answer(0)
- True False(0)
- Matching(0)