Exam 13: Multiple Regression Analysis
Exam 1: Introduction to Statistics94 Questions
Exam 2: Charts and Graphs92 Questions
Exam 3: Descriptive Statistics81 Questions
Exam 4: Probability87 Questions
Exam 5: Discrete Distributions88 Questions
Exam 6: Continuous Distributions90 Questions
Exam 7: Sampling and Sampling Distributions93 Questions
Exam 8: Statistical Inference: Estimation for Single Populations88 Questions
Exam 9: Statistical Inference: Hypothesis Testing for Single Populations101 Questions
Exam 10: Statistical Inferences About Two Populations98 Questions
Exam 11: A Nalysis of Variance and Design of Experiments106 Questions
Exam 12: Simple Regression Analysis and Correlation106 Questions
Exam 13: Multiple Regression Analysis93 Questions
Exam 14: Building Multiple Regression Models95 Questions
Exam 15: Time-Series Forecasting and Index Numbers94 Questions
Exam 16: Analysis of Categorical Data85 Questions
Exam 17: Nonparametric Statistics99 Questions
Exam 18: Statistical Quality Control86 Questions
Exam 19: Decision Analysis91 Questions
Select questions type
A multiple regression analysis produced the following tables. 
 These results indicate that ____________.
Free
(Multiple Choice)
4.8/5  (29)
(29)
Correct Answer: Verified
B
In a multiple regression analysis with N observations and k independent variables,the degrees of freedom for the residual error is given by (N - k).
Free
(True/False)
4.9/5 (32)
Correct Answer:Verified
False
In a multiple regression analysis with N observations and k independent variables,the degrees of freedom for the residual error is given by (N - k - 1).
Free
(True/False)
4.9/5 (30)
Correct Answer:Verified
True
A multiple regression analysis produced the following tables. 
 The coefficient of multiple determination is ____________.
(Multiple Choice)
4.8/5 (31)
A multiple regression analysis produced the following output from Minitab. Regression Analysis: Y versus x1 and x2
 S = 0.179449 R-Sq = 89.0% R-Sq(adj)= 87.8%
Analysis of Variance
S = 0.179449 R-Sq = 89.0% R-Sq(adj)= 87.8%
Analysis of Variance
 These results indicate that ____________.
(Multiple Choice)
4.9/5 (35)
The F value that is used to test for the overall significance of a multiple regression model is calculated by dividing the sum of mean squares regression (SSreg)by the sum of squares error (SSerr).
(True/False)
4.7/5 (38)
The F value that is used to test for the overall significance of a multiple regression model is calculated by dividing the mean square regression (MSreg)by the mean square error (MSerr).
(True/False)
4.8/5 (36)
A multiple regression analysis produced the following tables. 
 Using = 0.01 to test the null hypothesis H0: 1 = 2 = 0,the critical F value is ____.
(Multiple Choice)
4.7/5 (32)
A real estate appraiser is developing a regression model to predict the market value of single family residential houses as a function of heated area,number of bedrooms,number of bathrooms,age of the house,and central heating (yes,no).The response variable in this model is _______.
(Multiple Choice)
4.7/5 (41)
A multiple regression analysis produced the following tables.  Using = 0.05 to test the null hypothesis H0: 1 = 0,the correct decision is ____.
(Multiple Choice)
4.9/5 (34)
The F test is used to determine whether the overall regression model is significant.
(True/False)
4.8/5 (33)
The value of R2 always goes up when a nontrivial explanatory variable is added to a regression model.
(True/False)
4.9/5 (37)
The following ANOVA table is from a multiple regression analysis with n = 35 and four independent variables.  The adjusted R2 value is __________.
(Multiple Choice)
4.9/5 (34)
A market analyst is developing a regression model to predict monthly household expenditures on groceries as a function of family size,household income,and household neighborhood (urban,suburban,and rural).The response variable in this model is _____.
(Multiple Choice)
4.9/5 (34)
The following ANOVA table is from a multiple regression analysis.  The value of the standard error of the estimate se is __________.
(Multiple Choice)
4.9/5 (30)
The following ANOVA table is from a multiple regression analysis with n = 35 and four independent variables.  The number of degrees of freedom for error is __________.
(Multiple Choice)
4.9/5 (32)
A multiple regression analysis produced the following tables. 
 Using = 0.05 to test the null hypothesis H0: 1 = 2 = 0,the critical F value is ____.
(Multiple Choice)
4.8/5 (39)
The following ANOVA table is from a multiple regression analysis.  The number of independent variables in the analysis is __________.
(Multiple Choice)
4.8/5 (41)
A multiple regression analysis produced the following tables. 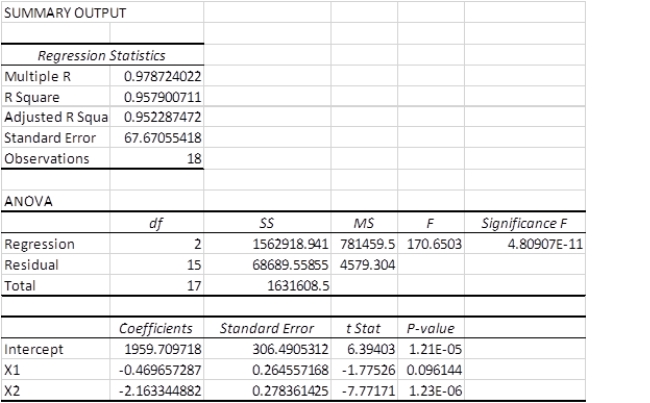 The sample size for this analysis is ____________.
(Multiple Choice)
4.9/5 (33)
A multiple regression analysis produced the following tables. 
 Using = 0.01 to test the null hypothesis H0: 2 = 0,the critical t value is ____.
(Multiple Choice)
4.7/5 (36)
Filters
- Essay(0)
- Multiple Choice(0)
- Short Answer(0)
- True False(0)
- Matching(0)