Exam 2: Charts and Graphs
Exam 1: Introduction to Statistics94 Questions
Exam 2: Charts and Graphs92 Questions
Exam 3: Descriptive Statistics81 Questions
Exam 4: Probability87 Questions
Exam 5: Discrete Distributions88 Questions
Exam 6: Continuous Distributions90 Questions
Exam 7: Sampling and Sampling Distributions93 Questions
Exam 8: Statistical Inference: Estimation for Single Populations88 Questions
Exam 9: Statistical Inference: Hypothesis Testing for Single Populations101 Questions
Exam 10: Statistical Inferences About Two Populations98 Questions
Exam 11: A Nalysis of Variance and Design of Experiments106 Questions
Exam 12: Simple Regression Analysis and Correlation106 Questions
Exam 13: Multiple Regression Analysis93 Questions
Exam 14: Building Multiple Regression Models95 Questions
Exam 15: Time-Series Forecasting and Index Numbers94 Questions
Exam 16: Analysis of Categorical Data85 Questions
Exam 17: Nonparametric Statistics99 Questions
Exam 18: Statistical Quality Control86 Questions
Exam 19: Decision Analysis91 Questions
Select questions type
Given two class intervals and their respective frequencies and relative frequencies,the ratio of the frequencies _________ the ratio of the relative frequencies.
Free
(Multiple Choice)
4.9/5  (33)
(33)
Correct Answer: Verified
B
The following graphic of residential housing data (selling price and size in square feet)indicates _____________. 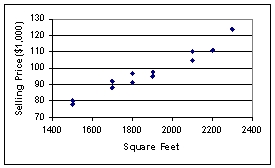
Free
(Multiple Choice)
4.9/5 (32)
Correct Answer:Verified
C
If the individual class frequency is divided by the total frequency,the result is the median frequency.
Free
(True/False)
4.8/5 (33)
Correct Answer:Verified
False
A recent survey of U.S.automobile owners showed the following preferences for exterior automobile colors: 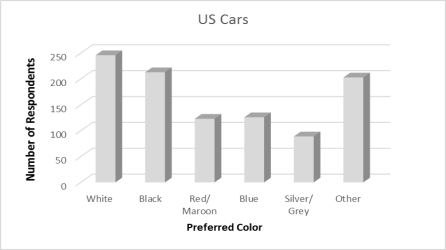 What type of graph is used to depict exterior automobile color preferences?
(Multiple Choice)
4.8/5 (41)
Scott Brim,Chief Financial Officer of Space Mall,Inc.,wants to better understand the busiest business hours during the weekend.There are door sensors that approximately count the number of people who enter the mall.The table below presents the average number of people coming in during the weekend,for the last month:  The relative frequency of the fourth class interval is _________.
(Multiple Choice)
5.0/5 (33)
A summary of data in which raw data are grouped into different intervals and the number of items in each group is listed is called a frequency distribution.
(True/False)
4.9/5 (32)
Your company is doing market research to assess the feasibility of a new product.The market research team gathers pricing information of all the existing products that would compete with your company's product.The most expensive brand is priced at $22.95,and the least expensive one at $20.59.If a class width of 0.25 is used,then the number of classes will be
(Multiple Choice)
4.9/5 (31)
Consider the relative frequency distribution given below:  There were 60 numbers in the data set. How many numbers were in the interval 20-under 40?
(Multiple Choice)
4.8/5 (43)
In contrast to quantitative data graphs that are plotted along a numerical scale,qualitative graphs are plotted using non-numerical categories.
(True/False)
4.9/5 (34)
A scatter plot is useful for examining the relationship between two numerical variables.
(True/False)
4.9/5 (26)
The number of phone calls arriving at a switchboard each hour has been recorded,and the following frequency distribution has been developed. 
(Multiple Choice)
4.7/5 (34)
An instructor made a frequency table of the scores his students got on a test 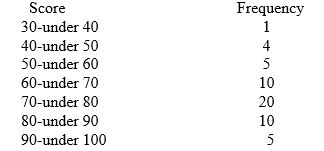 The midpoint of the last class interval is _________.
(Multiple Choice)
4.9/5 (34)
Consider the following frequency distribution:  What is the midpoint of the last class interval?
(Multiple Choice)
4.9/5 (31)
The staff of Ms.Tamara Hill,VP of Technical Analysis at Blue Sky Brokerage,prepared a frequency histogram of market capitalization of the 937 corporations listed on the American Stock Exchange in January 2013. 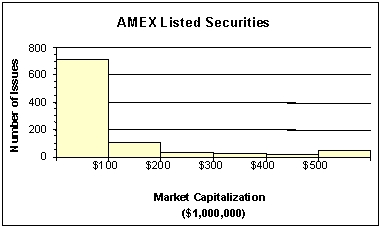 Approximately ________ corporations had capitalizations of $200,000,000 or less.
(Multiple Choice)
4.8/5 (36)
A scatter plot shows how the numbers in a data set are scattered around their average.
(True/False)
4.8/5 (27)
Consider the relative frequency distribution given below:  There were 60 numbers in the data set. How many of the number were less than 80?
(Multiple Choice)
4.8/5 (31)
Your company is doing market research to assess the feasibility of a new product.The market research team gathers pricing information of the 60 existing products in the market that would compete with your company's product.The most expensive brand is priced at $22.95,and the least expensive one at $20.59.If the relative frequency of the first class is 0.05 and the cumulative frequency for the second class is 10,then the relative frequency for the second class is
(Multiple Choice)
4.9/5 (29)
Consider the following frequency distribution:  What is the cumulative frequency of the second class interval?
(Multiple Choice)
4.9/5 (43)
Filters
- Essay(0)
- Multiple Choice(0)
- Short Answer(0)
- True False(0)
- Matching(0)