Exam 12: Simple Regression Analysis and Correlation
Exam 1: Introduction to Statistics94 Questions
Exam 2: Charts and Graphs92 Questions
Exam 3: Descriptive Statistics81 Questions
Exam 4: Probability87 Questions
Exam 5: Discrete Distributions88 Questions
Exam 6: Continuous Distributions90 Questions
Exam 7: Sampling and Sampling Distributions93 Questions
Exam 8: Statistical Inference: Estimation for Single Populations88 Questions
Exam 9: Statistical Inference: Hypothesis Testing for Single Populations101 Questions
Exam 10: Statistical Inferences About Two Populations98 Questions
Exam 11: A Nalysis of Variance and Design of Experiments106 Questions
Exam 12: Simple Regression Analysis and Correlation106 Questions
Exam 13: Multiple Regression Analysis93 Questions
Exam 14: Building Multiple Regression Models95 Questions
Exam 15: Time-Series Forecasting and Index Numbers94 Questions
Exam 16: Analysis of Categorical Data85 Questions
Exam 17: Nonparametric Statistics99 Questions
Exam 18: Statistical Quality Control86 Questions
Exam 19: Decision Analysis91 Questions
Select questions type
In regression analysis,R-squared is also called the _______.
(Multiple Choice)
4.9/5  (38)
(38)
Regression output from Minitab software includes an ANOVA table.
(True/False)
4.8/5 (32)
A researcher has developed a regression model from fifteen pairs of data points.He wants to test if the slope is significantly different from zero.He uses a two?tailed test and = 0.10.The critical table t value is _______.
(Multiple Choice)
4.7/5 (38)
A manager wishes to predict the annual cost (y)of an automobile based on the number of miles (x)driven. The following model was developed: y = 2,000 + 0.42x.If a car is driven 20,000 miles,the predicted cost is ____________.
(Multiple Choice)
4.7/5 (34)
A cost accountant is developing a regression model to predict the total cost of producing a batch of printed circuit boards as a linear function of batch size (the number of boards produced in one lot or batch).The intercept of this model is the ______.
(Multiple Choice)
4.7/5 (31)
In regression,the variable that is being predicted is usually referred to as the independent variable.
(True/False)
4.7/5 (37)
A researcher has developed the regression equation y = 2.164 + 1.3657x,where n = 6,the mean of x is 8.667,Sxx = 89.333,and Se = 3.44.The 90% confidence prediction interval for y when x = 1 is ______.
(Multiple Choice)
4.9/5 (33)
The equation of the trend line for the data based on sales (in $1000)of a local restaurant over the years 2005-2010 is Sales= -265575+132.571 year.The equation of the trend line when using 1 to 6 for 2005-2010 is ________
(Multiple Choice)
4.9/5 (34)
A researcher has developed the regression equation y = 2.164 + 1.3657x,where n = 6,the mean of x is 8.667,Sxx = 89.333,and Se = 3.44.The researcher wants to test if the slope is significantly positive,and he chooses a significance level of 0.05.The observed t value is ______.
(Multiple Choice)
4.8/5 (37)
A regression line minimizes the sum of the squared error values.This means that the regression line minimizes the sum of ______ from each point in the scatter point to the regression line.
(Multiple Choice)
4.9/5 (34)
In the regression equation,y=2.164+1.3657x n=6,the mean of x is 8.667,Sxx=89.333 and Se=3.44.A 95% prediction interval for y when x=8 is _________
(Multiple Choice)
4.9/5 (37)
From the following scatter plot,we can say that between y and x there is _______. 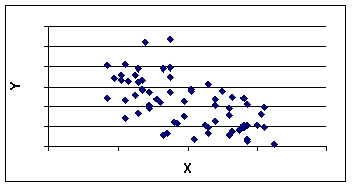
(Multiple Choice)
4.8/5 (40)
Annie Mikhail,market analyst for a national company specializing in historic city tours,is analyzing the relationship between the sales revenue from historic city tours and the size of the city.She gathers data from six cities in which the tours are offered.Annie's dependent variable is annual sales revenues and her independent variable is the city population.Regression analysis of the data yielded the following tables. 
 For a city with a population of 500,000,Annie's model predicts annual sales of ________________.
(Multiple Choice)
4.8/5 (33)
If x and y in a regression model are totally unrelated,_______.
(Multiple Choice)
4.9/5 (41)
Abby Kratz,a market specialist at the market research firm of Saez,Sikes,and Spitz,is analyzing household budget data collected by her firm. Abby's dependent variable is monthly household expenditures on groceries (in $'s),and her independent variable is annual household income (in $1,000's). Regression analysis of the data yielded the following tables.  11ea8a11_bc89_8e88_9fff_afc23a5184cd_TB6468_00 The correlation coefficient between the two variables in this regression is __________.s),and her independent variable is annual household income (in $1,000's). Regression analysis of the data yielded the following tables. The correlation coefficient between the two variables in this regression is __________." class="answers-bank-image d-inline" loading="lazy" > The correlation coefficient between the two variables in this regression is __________.s),and her independent variable is annual household income (in $1,000's). Regression analysis of the data yielded the following tables. The correlation coefficient between the two variables in this regression is __________." class="answers-bank-image d-inline" loading="lazy" > 11ea8a11_bc89_8e88_9fff_afc23a5184cd_TB6468_00 The correlation coefficient between the two variables in this regression is __________.
(Multiple Choice)
4.8/5 (38)
The assumptions underlying simple regression analysis include ______________.
(Multiple Choice)
4.8/5 (29)
Correlation is a measure of the degree of linear relationship between two variables.
(True/False)
4.9/5 (35)
A standard deviation of the error of the regression model is called the _______.
(Multiple Choice)
4.8/5 (41)
According to the following graphic,X and Y have _________. 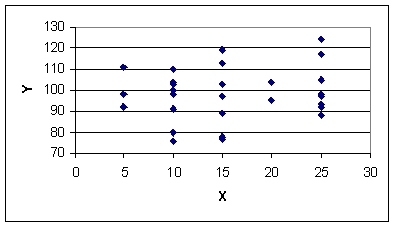
(Multiple Choice)
4.8/5 (35)
Filters
- Essay(0)
- Multiple Choice(0)
- Short Answer(0)
- True False(0)
- Matching(0)