Exam 13: Multiple Regression Analysis
Exam 1: Introduction to Statistics94 Questions
Exam 2: Charts and Graphs92 Questions
Exam 3: Descriptive Statistics81 Questions
Exam 4: Probability87 Questions
Exam 5: Discrete Distributions88 Questions
Exam 6: Continuous Distributions90 Questions
Exam 7: Sampling and Sampling Distributions93 Questions
Exam 8: Statistical Inference: Estimation for Single Populations88 Questions
Exam 9: Statistical Inference: Hypothesis Testing for Single Populations101 Questions
Exam 10: Statistical Inferences About Two Populations98 Questions
Exam 11: A Nalysis of Variance and Design of Experiments106 Questions
Exam 12: Simple Regression Analysis and Correlation106 Questions
Exam 13: Multiple Regression Analysis93 Questions
Exam 14: Building Multiple Regression Models95 Questions
Exam 15: Time-Series Forecasting and Index Numbers94 Questions
Exam 16: Analysis of Categorical Data85 Questions
Exam 17: Nonparametric Statistics99 Questions
Exam 18: Statistical Quality Control86 Questions
Exam 19: Decision Analysis91 Questions
Select questions type
In a multiple regression model,the partial regression coefficient of an independent variable represents the increase in the y variable when that independent variable is increased by one unit if the values of all other independent variables are held constant.
(True/False)
4.9/5  (41)
(41)
A cost accountant is developing a regression model to predict the total cost of producing a batch of printed circuit boards as a linear function of batch size (the number of boards produced in one lot or batch),production plant (Kingsland,and Yorktown),and production shift (day,and evening). In this model,"batch size" is ______.
(Multiple Choice)
4.9/5 (30)
The model y = 0 + 1x1 + 2x2 + 3x3 + is a first-order regression model.
(True/False)
4.8/5 (32)
A multiple regression analysis produced the following output from Excel.  The overall proportion of variation of y accounted by x1 and x2 is _______
(Multiple Choice)
4.8/5 (36)
A multiple regression analysis produced the following tables. 
 If x1= 25 and x2 = 85,then the predicted value of y is ____________.
(Multiple Choice)
4.9/5 (32)
A multiple regression analysis produced the following output from Excel.  The coefficient of multiple determination is ____________.
(Multiple Choice)
4.7/5 (40)
The following ANOVA table is from a multiple regression analysis.  The SSE value is __________.
(Multiple Choice)
5.0/5 (41)
Minitab and Excel output for a multiple regression model show the t tests for the regression coefficients but do not provide a t test for the regression constant.
(True/False)
4.8/5 (30)
A multiple regression analysis produced the following tables. 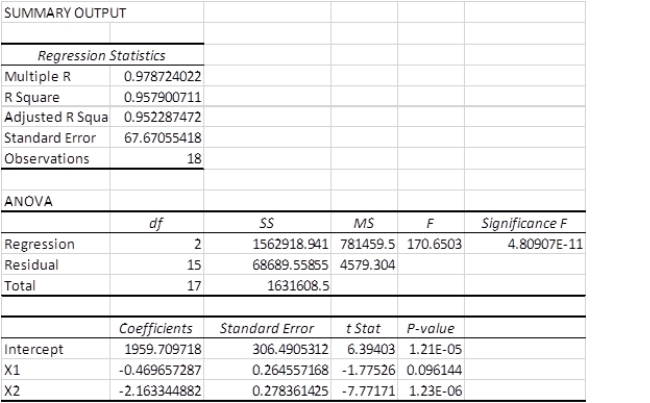 These results indicate that ____________.
(Multiple Choice)
4.8/5 (33)
Suppose that the regression equation y = 16.99 + 0.32 x1 + 0.41 x2 + 5.31 x3 predicts an adult's height (y)given the individual's mother's height (x1),his or her father's height (x2),and whether the individual is male (x3 = 1)or female (x3 = 0).All heights are measured in inches.Assume also that this equation is stable through time,the average adult female height is currently 63.8 inches and the average adult male height is 69.7 inches.Approximately what would be the average female height in two generations? You can assume that each individual has parents of average height.
(Multiple Choice)
4.7/5 (49)
A human resources analyst is developing a regression model to predict electricity production plant manager compensation as a function of production capacity of the plant,number of employees at the plant,and plant technology (coal,oil,and nuclear). The response variable in this model is ______.
(Multiple Choice)
4.8/5 (33)
The mean square error (MSerr)is calculated by dividing the sum of squares error (SSerr)by the number of observations in the data set (N).
(True/False)
4.7/5 (40)
A multiple regression analysis produced the following tables. 
 Using = 0.01 to test the null hypothesis H0: 1 = 2 = 0,the critical F value is ____.
(Multiple Choice)
4.8/5 (26)
A human resources analyst is developing a regression model to predict electricity production plant manager compensation as a function of production capacity of the plant,number of employees at the plant,and plant technology (coal,oil,and nuclear).The "plant technology" variable in this model is ______.
(Multiple Choice)
4.9/5 (33)
A market analyst is developing a regression model to predict monthly household expenditures on groceries as a function of family size,household income,and household neighborhood (urban,suburban,and rural).The "neighborhood" variable in this model is ______.
(Multiple Choice)
4.8/5 (35)
The multiple regression formulas used to estimate the regression coefficients are designed to ________________.
(Multiple Choice)
4.9/5 (37)
A multiple regression analysis produced the following tables. 
 The sample size for this analysis is ____________.
(Multiple Choice)
4.7/5 (35)
The following ANOVA table is from a multiple regression analysis with n = 35 and four independent variables.  The MSE value is __________.
(Multiple Choice)
4.9/5 (44)
In a multiple regression model,the proportion of the variation of the dependent variable,y,accounted for the independent variables in the regression model is given by the coefficient of multiple correlation.
(True/False)
4.8/5 (39)
Filters
- Essay(0)
- Multiple Choice(0)
- Short Answer(0)
- True False(0)
- Matching(0)