Exam 13: Multiple Regression Analysis
Exam 1: Introduction to Statistics94 Questions
Exam 2: Charts and Graphs92 Questions
Exam 3: Descriptive Statistics81 Questions
Exam 4: Probability87 Questions
Exam 5: Discrete Distributions88 Questions
Exam 6: Continuous Distributions90 Questions
Exam 7: Sampling and Sampling Distributions93 Questions
Exam 8: Statistical Inference: Estimation for Single Populations88 Questions
Exam 9: Statistical Inference: Hypothesis Testing for Single Populations101 Questions
Exam 10: Statistical Inferences About Two Populations98 Questions
Exam 11: A Nalysis of Variance and Design of Experiments106 Questions
Exam 12: Simple Regression Analysis and Correlation106 Questions
Exam 13: Multiple Regression Analysis93 Questions
Exam 14: Building Multiple Regression Models95 Questions
Exam 15: Time-Series Forecasting and Index Numbers94 Questions
Exam 16: Analysis of Categorical Data85 Questions
Exam 17: Nonparametric Statistics99 Questions
Exam 18: Statistical Quality Control86 Questions
Exam 19: Decision Analysis91 Questions
Select questions type
A market analyst is developing a regression model to predict monthly household expenditures on groceries as a function of family size,household income,and household neighborhood (urban,suburban,and rural).The "income" variable in this model is ____.
(Multiple Choice)
4.9/5  (34)
(34)
A cost accountant is developing a regression model to predict the total cost of producing a batch of printed circuit boards as a linear function of batch size (the number of boards produced in one lot or batch),production plant (Kingsland,and Yorktown),and production shift (day,and evening). In this model,"shift" is ______.
(Multiple Choice)
4.8/5 (27)
A multiple regression analysis produced the following tables. 
 These results indicate that ____________.
(Multiple Choice)
4.8/5 (32)
A multiple regression analysis produced the following tables. 
 For x1= 30 and x2 = 100,the predicted value of y is ____________.
(Multiple Choice)
4.9/5 (38)
A multiple regression analysis produced the following tables. 
 The coefficient of multiple determination is ____________.
(Multiple Choice)
4.9/5 (34)
In the regression equation y = 1959.71 − 0.46 x1 + 2.16 x2,suppose that the you are considering the point (x1,x2)= (1.5,0.5),and furthermore,suppose that the variable x1 increases by a factor of 2 (i.e.,it doubles).What must be the change in the variable x2 so that y remains unchanged?
(Multiple Choice)
4.8/5 (30)
A multiple regression analysis produced the following output from Excel. 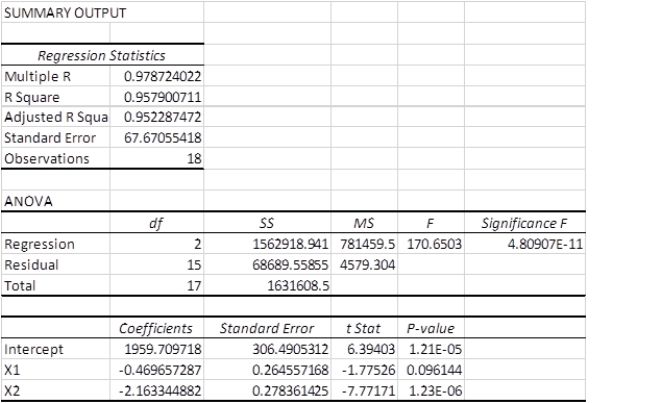 The correlation coefficient is ____________.
(Multiple Choice)
4.8/5 (31)
A multiple regression analysis produced the following tables. 
 The adjusted R2 is ____________.
(Multiple Choice)
4.9/5 (42)
The value of adjusted R2 always goes up when a nontrivial explanatory variable is added to a regression model.
(True/False)
4.9/5 (33)
The following ANOVA table is from a multiple regression analysis.  The adjusted R2 value is __________.
(Multiple Choice)
4.8/5 (22)
A multiple regression analysis produced the following tables. 
 Using = 0.10 to test the null hypothesis H0: 2 = 0,the critical t value is ____.
(Multiple Choice)
4.8/5 (38)
A multiple regression analysis produced the following tables. 
 Using = 0.05 to test the null hypothesis H0: 1 = 0,the critical t value is ____.
(Multiple Choice)
4.9/5 (23)
The following ANOVA table is from a multiple regression analysis.  The R2 value is __________.
(Multiple Choice)
4.9/5 (32)
Filters
- Essay(0)
- Multiple Choice(0)
- Short Answer(0)
- True False(0)
- Matching(0)