Exam 15: Time-Series Forecasting and Index Numbers
Exam 1: Introduction to Statistics94 Questions
Exam 2: Charts and Graphs92 Questions
Exam 3: Descriptive Statistics81 Questions
Exam 4: Probability87 Questions
Exam 5: Discrete Distributions88 Questions
Exam 6: Continuous Distributions90 Questions
Exam 7: Sampling and Sampling Distributions93 Questions
Exam 8: Statistical Inference: Estimation for Single Populations88 Questions
Exam 9: Statistical Inference: Hypothesis Testing for Single Populations101 Questions
Exam 10: Statistical Inferences About Two Populations98 Questions
Exam 11: A Nalysis of Variance and Design of Experiments106 Questions
Exam 12: Simple Regression Analysis and Correlation106 Questions
Exam 13: Multiple Regression Analysis93 Questions
Exam 14: Building Multiple Regression Models95 Questions
Exam 15: Time-Series Forecasting and Index Numbers94 Questions
Exam 16: Analysis of Categorical Data85 Questions
Exam 17: Nonparametric Statistics99 Questions
Exam 18: Statistical Quality Control86 Questions
Exam 19: Decision Analysis91 Questions
Select questions type
Using a three-month moving average,the forecast value for November in the following time series is ____________. 
(Multiple Choice)
4.7/5  (45)
(45)
When constructing a weighted aggregate price index,the weights usually are _____.
(Multiple Choice)
4.7/5 (35)
If autocorrelation occurs in regression analysis,then the confidence intervals and tests using the t and F distributions are no longer strictly applicable.
(True/False)
4.9/5 (41)
A time series analysis was performed to determine the number of new online customers that joined the 'Jelly of the Month Club'. The actual number of new customers,the forecast values and error terms is presented in the following table. The mean error (ME)for this forecast is ___________. 
(Multiple Choice)
4.9/5 (34)
Analysis of data for an autoregressive forecasting model produced the following tables. 
 The actual values of this time series,y,were 228,54,and 191 for May,June,and July,respectively.The forecast value predicted by the model for July is __________.
(Multiple Choice)
4.9/5 (37)
Fitting a linear trend to 36 monthly data points (January 2011 = 1,February 2011 =2,March 2011 = 3,etc.)produced the following tables. 
 The projected trend value for January 2014 is ________.
(Multiple Choice)
5.0/5 (28)
Use of a smoothing constant value less than 0.5 in an exponential smoothing model gives more weight to ___________.
(Multiple Choice)
4.8/5 (38)
The following graph of a time-series data suggests a _______________ trend. 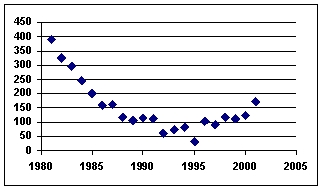
(Multiple Choice)
4.9/5 (31)
Jim Royo,manager of Billings Building Supply (BBS),wants to develop a model to forecast BBS's monthly sales (in $1,000's). He selects the dollar value of residential building permits (in $10,000)as the predictor variable. An analysis of the data yielded the following tables. 
 Jim's calculated value for the Durbin-Watson statistic is 1.93. Using = 0.05,the appropriate decision is: _________.
(Multiple Choice)
4.8/5 (31)
A time series with forecast values is presented in the following table:  If the mean square error (MSE)until September is 0.01125,and the overall MSE is 0.010125,
Then x = ______.
If the mean square error (MSE)until September is 0.01125,and the overall MSE is 0.010125,
Then x = ______.
(Multiple Choice)
4.9/5 (29)
An exponential smoothing technique in which the smoothing constant alpha is equal to one is equivalent to a regression forecasting model.
(True/False)
4.9/5 (32)
Two popular general categories of smoothing techniques are exponential models and logarithmic models.
(True/False)
4.9/5 (28)
Using 2011 as the base year,the 2010 value of the Paasche' Price Index is ______. 
(Multiple Choice)
4.9/5 (35)
A time series with forecast values is presented in the following table:  On this table,a is some nondisclosed value.The mean absolute deviation (MAD)
Is ______% of a.
On this table,a is some nondisclosed value.The mean absolute deviation (MAD)
Is ______% of a.
(Multiple Choice)
4.8/5 (24)
If the trend equation is quadratic in time t=1….T,the forecast value for the next time T+1 depends on time T.
(True/False)
4.8/5 (26)
Jim Royo,manager of Billings Building Supply (BBS),wants to develop a model to forecast BBS's monthly sales (in $1,000's). He selects the dollar value of residential building permits (in $10,000)as the predictor variable. An analysis of the data yielded the following tables. 
 Using = 0.05 the critical value of the Durbin-Watson statistic,dL, is _________.
(Multiple Choice)
4.8/5 (31)
Linear regression models cannot be used to analyze quadratic trends in time-series data.
(True/False)
4.9/5 (41)
The table below shows the prices in $ and quantities (thousands)for five specialized electronic components for 2000 and 2016.  The Laspeyres price index for 2016 using 2000 as base year is ______.
(Multiple Choice)
4.7/5 (33)
The city golf course is interested in starting a junior golf program.The golf pro has collected data on the number of youths under 13 that have played golf during the last 4 months.Using a three-month moving average,the forecast value for November in the following time series would be ____________. 
(Multiple Choice)
4.7/5 (31)
Suppose that for a time-series model,you compute a Durbin-Watson statistic D = 0.625.Assume that n = 30 and α = 0.05.Then your decision is ______.
(Multiple Choice)
4.9/5 (30)
Filters
- Essay(0)
- Multiple Choice(0)
- Short Answer(0)
- True False(0)
- Matching(0)